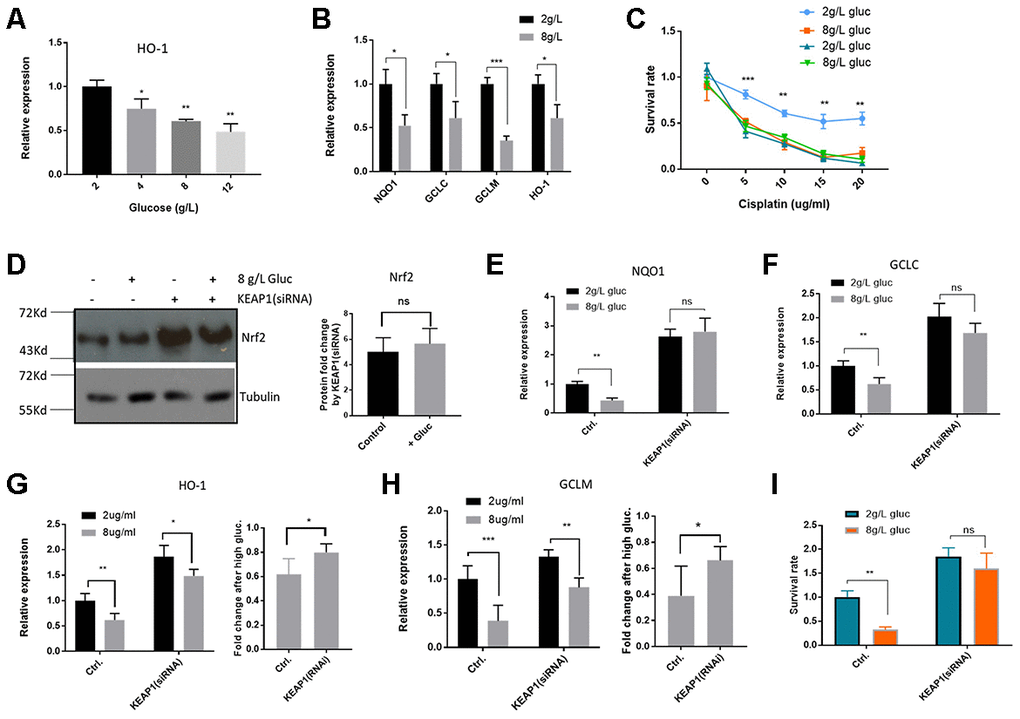
Figure 4.High glucose medium suppressed Nrf2-mediated transcription in HepG2/DDP cells. (A) High glucose decreased Nrf2 target gene HO-1 expression in a dose-dependent manner. HepG2/DDP cells were cultured RPMI-1640 with indicated concentrations of glucose medium for 24 hours and total mRNA was extracted and reverse transcribed. RT-qPCR was carried out to compare the relative expression of HO-1. Significance was tested by student’s t-test (*P<0.05, **P<0.001). (B) Glucose at 8g/L suppressed other Nrf2 target genes. Experiments were conducted as in (A) by using qPCR primers specific to NQO1, GCLC and GCLM. Data were normalized to 2g/L glucose (normal RPMI glucose concentration) for each individual gene. Significance was tested by student’s t-test (*P<0.05, ***P<0.0001). (C) Glucose at 8g/L increased cisplatin killing of HepG2/DDP cells. HepG2/DDP and HepG2 cells cultured in normal RPMI-1640) were shifted to normal (2g/L) or high glucose (8g/L) RPMI-1640 for 24 hours then cisplatin at indicated concentrations was added. After 24 hours, cell viability was measured with Cell Titer-Glo. Data from 2 independent experiments were normalized to the average of non-treated controls. Significance was tested by student’s t-test (** P<0.001, *** P<0.0001). (D) KEAP1 knockdown increased Nrf2 protein levels in a glucose-independent manner. HepG2/DDP cells were transfected with KEAP1-specific siRNAs for 24 hours and shifted to normal or high glucose medium for 24 hours. Total cell lysates were analyzed by SDS-PAGE and Western blotting. Representative images were shown. Quantification of N= 2 biological repeats were shown in bar graph. (E–H) KEAP1 knockdown prevented glucose from suppressing Nrf2 target genes. siRNA knockdown and glucose conditioning conducted as in (D). Relative expression of indicated genes was quantified by RT-qPCR. Comparison of fold change was shown in (G) and (H). Significance was tested by student’s t-test ((* P<0.05, ** P<0.001, ns, not significant). (I) KEAP1 knockdown preventing glucose from enhancing cisplatin toxicity. siRNA knockdown and glucose conditioning conducted as in (D). HepG2/DDP cells then treated with cisplatin (10ug/ml) for 24 hours. Relative cell viability was measured by Cell Titer-Glo. Data from 2 independent of 3 replicates were normalized to the control and analyzed with student’s t-test (** P<0.001, ns, not significant).