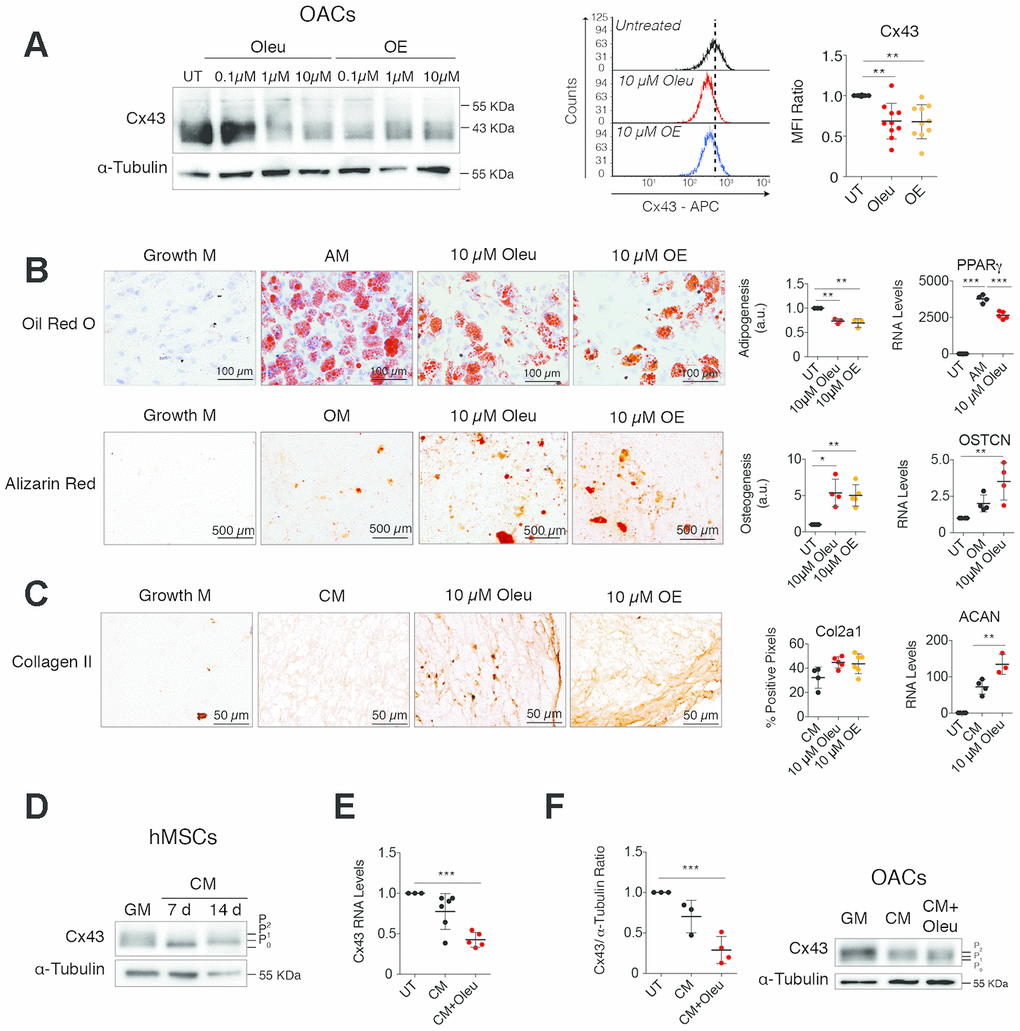
Figure 1.Downregulation of Cx43 during chondrogenesis improves differentiation towards chondrocytes. (A) Treatment of OACs with oleuropein (Oleu) or olive extract (OE) for 2 h significantly downregulates Cx43 protein detected by western-blot and flow cytometry. Median fluorescence intensity (MFI) ratios of oleuropein and OE treatments with respect to their untreated controls of each experiment are represented (n=10 independent experiments, P=0.0003). (B) Differentiation capacity of hMSCs isolated from bone marrow grown in adipogenic (top, 21 days) or osteogenic (bottom, 21 days) medium supplemented with 10 μM oleuropein or 10 μM OE. hMSCs cultured in growth medium were used as a control. Top, adipogenic evaluation by oil red O for lipid staining and by PPARγ gene expression. Data represent the ratio of cells containing lipid deposits to the total number of cells (n=3 independent experiments, P<0.0001). Values were normalized to hMSCs differentiated in adipogenic medium without treatment (AM). On the right, PPARγ gene expression (n=4 independent experiments, P<0.0001). Alizarin red staining was used to detect calcium deposits for osteogenic differentiation. Values were obtained by counting red pixels and normalized to those of hMSCs differentiated in osteogenic medium without treatment (OM) (n=4-6 independent experiments, P=0.0317). OSTCN gene expression was measured to confirm osteogenic differentiation (n=4 independent experiments, P=0.0055). (C) Differentiation capacity of hMSCs isolated from bone marrow grown in chondrogenic medium as micromasses for 30 days. Representative images for Col2A1. The quantification is shown on the right (n=5–6 micromasses from independent experiments, P=0.0423). Chondrogenesis was also evaluated by ACAN gene expression quantification (n=3–4 independent experiments, P<0.0001). (D) Cx43 protein levels in hMSCs, isolated from bone marrow and from inguinal fat, differentiated for 7 and 14 days in the presence of chondrogenic medium (CM) in comparison to untreated hMSCs cultured in normal growth medium (GM). (E) Cx43 RNA expression of hMSCs cultured for 14 days in the presence of chondrogenic medium (CM) alone or supplemented with 10 μM oleuropein. Data were normalized to HPRT-1 levels (n=5-6 independent experiments, P<0.0001). (F) Cx43 protein levels were analyzed by western blot in OACs differentiated for 7 days in the presence of chondrogenic medium (CM), supplemented with 10 μM oleuropein. The graph represents the quantification from 3 independent experiments (P=0.0004). Data is expressed as mean±SD, one-way ANOVA; *P<0.05, **P<0.01 and ***P<0.0001.