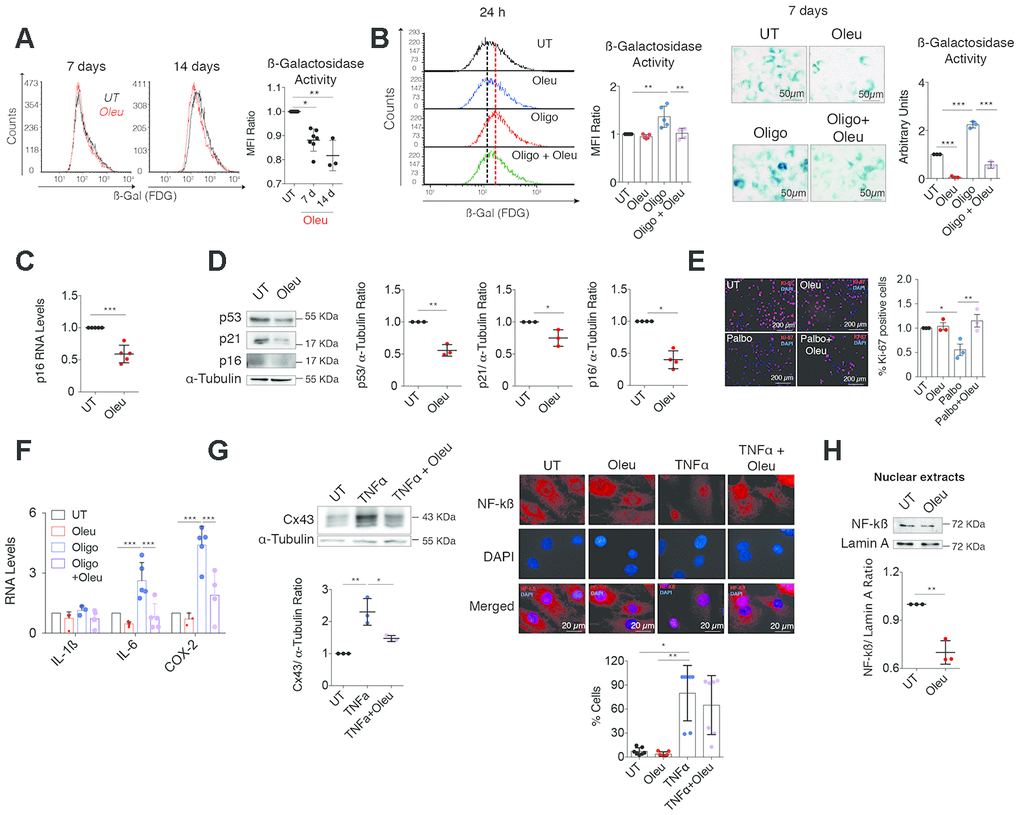
Figure 5.Cx43 downregulation by oleuropein decreased chondrocyte senescence. (A) SA-βGal activity detected by flow cytometry in OACs treated with 10 μM oleuropein (Oleu) for 7 and 14 days (n=3–7 independent experiments; one-way ANOVA, P<0.0001). (B) The graphs show the comparative analysis of SA-βGal activity measured by flow cytometry of OACs exposed for 24 h to 10 μM oleuropein or 5 μg/ml oligomycin as indicated (n=5 independent experiments; one-way ANOVA, P=0.0003). On the right, SA-βGal activity determined by X-Gal cleavage and cell staining (blue), evaluated by microscopy in OACs treated for 7 days with 10 μM oleuropein or 5 μg/ml oligomycin (n=3 independent experiments; one-way ANOVA, P<0.0001). (C) p16 mRNA expression of OACs treated with 10 μM oleuropein for 2 h. Data were normalized to HPRT-1 levels (n=5 independent experiments; Student’s t test, P=0.0002). (D) Western blot of p53 (n=3 independent experiments), p21 (n=3 independent experiments) and p16 (n=4 independent experiments) in OACs treated with 10 μM oleuropein for 2 h. α-tubulin was used as a loading control. Student’s t test, P=0.001 (p53), P=0.0278 (p21), P=0.0286 (p16). (E) Cell proliferation evaluated by immunofluorescence of Ki-67 in T/C-28a2 chondrocytes treated with 10 μM palbociclib and/or 10 μM oleuropein for 24 h. Images represent n= 3 independent experiments. One-way ANOVA, P=0.0434 (UT vs Palbo); P=0.0096 (Palbo vs Palbo+Oleu). (F) Downregulation of Cx43 by oleuropein attenuates IL-6 and COX-2 upregulation when OACs are exposed to oligomycin for 1 h (n=3–9 independent experiments; one-way ANOVA). (G) Western blot (n=3 independent experiments) shows the effect of 10 μM oleuropein and 10 ng/mL TNFα treatments (for 1 h) on Cx43 protein levels in OACs (one-way ANOVA, P=0.0018). On the right, NF-κB detected by immunofluorescence in OACs treated with 10 ng/mL TNFα for 1 h. This effect is partially abolished by 1-h 10 μM oleuropein treatment. The graph represents the cell percentage with nuclear NF-κB staining (n=7 independent experiments; one-way ANOVA, P=0.0055). (H) Nuclear levels of NF-kß in OACs cultured with 10 μM oleuropein for 2 h. Lamin A was used as a loading control (n=3 independent experiments; Student’s t test, P=0.0021). Data is expressed as mean±SD; *P<0.05, **P<0.01 and ***P<0.0001.