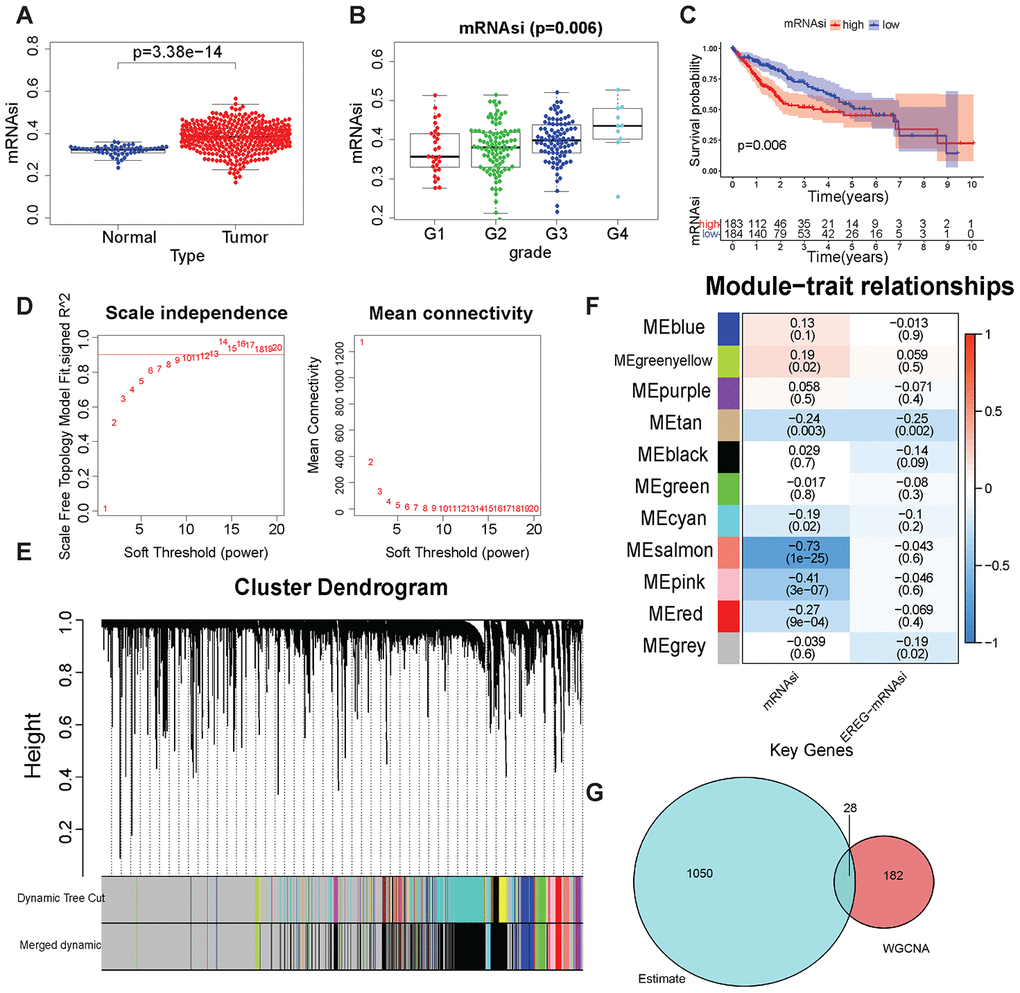
Figure 2.Tumor stem cell score and WGCNA-related results. (A) mRNAsi in LIHC and normal samples. (B) mRNAsi was in different grades. (C) Kaplan–Meier plot of high- or low-mRNAsi patients from TCGA. The number of patients remaining at a particular time point is shown at the bottom. (D) Left: The determination coefficient R2 of the y-axis is −log10 (k) and log10 (P(k)). The larger the R2, the more the gene regulatory network conformed to the scale-free network. k, Connectivity of the gene nodes; P(k), probability of such a node. Red line: 0.9. The x-axis is the soft threshold beta. Right: the average connectivity of the y-axis genes. The x-axis is the soft threshold β. (E) Gene clustering and gene module partition results. Gene clustering and gene module division results. “Dynamic Tree Cut” is the result before the modules were merged; “Merged dynamic” is the result after the modules were merged. (F) The result of the module–trait relationship. The Pearson correlation coefficient of the first principal component of the gene module and the traits was plotted as a heat map, where the P values are marked in parentheses. (G) The intersection of the ESTIMATE algorithm and mRNAsi + WGCNA-derived genes. These 28 genes were considered to be closely related to the tumor stem cell content and the degree of immunity.