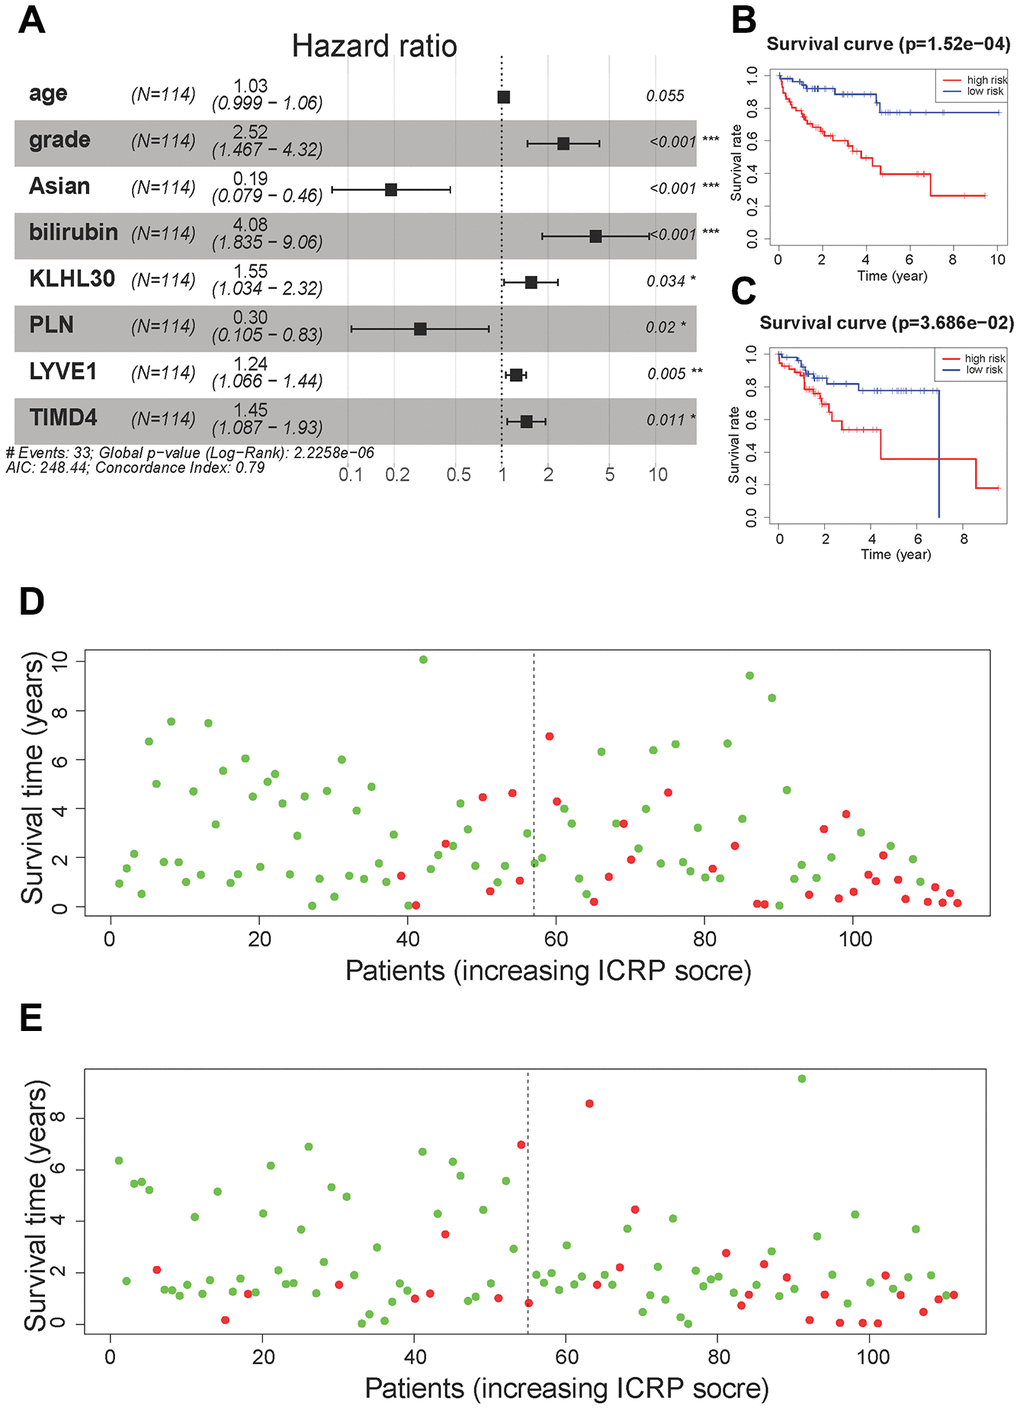
Figure 4.Cox regression model results. (A) A forest plot of the multivariate Cox regression model. Hazard ratio is provided in the figure. (B) The survival curve of the ICRP score in the training set. Grouping was based on the median ICRP score in the training set. Red is the high-level group, and blue is the low-level group. (C) The survival curve of the ICRP score in the test set. Grouping was based on the median ICRP score in the training set. (D) Patient survival status in the training set. The x-axis is the patient ranking in ascending order by the ICRP score; the y-axis is the survival time. The red dots are the dead patients, and the green dots are the surviving patients. (E) Patient survival status in the test set.