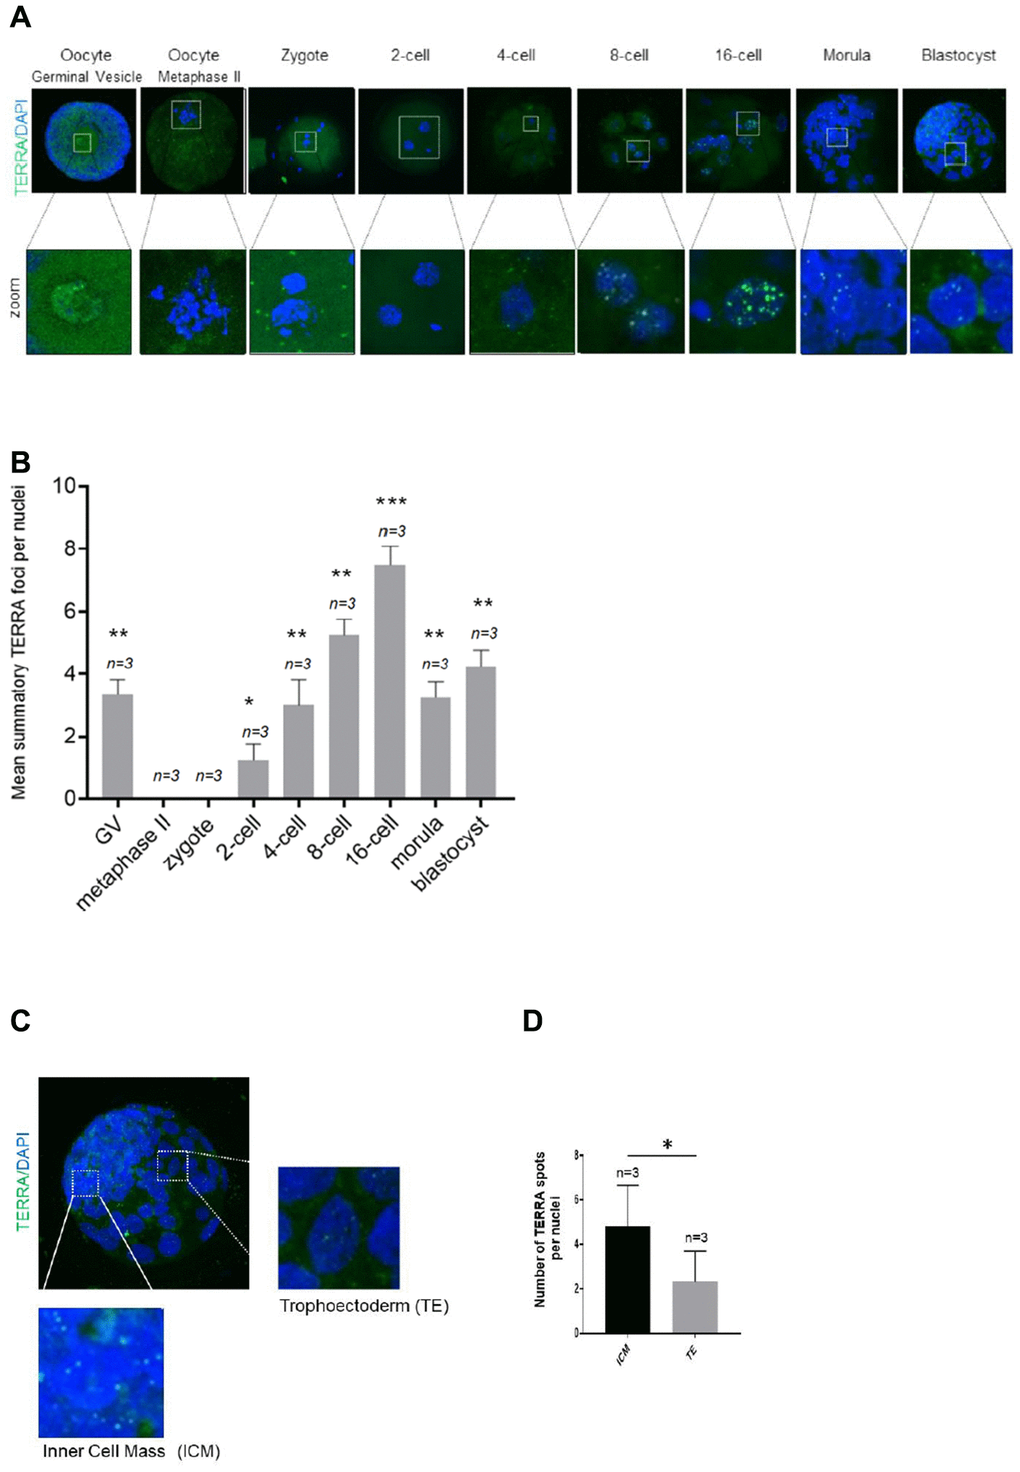
Figure 1.TERRA expression in bovine oocytes, early cleavage and blastocyst stage. (A) The TERRA signal was detected by RNA-FISH on bovine oocytes and different cleavage stages of bovine early embryos and blastocysts using a probe targeting TERRA’s telomeric track (green), DAPI=blue. Zoom areas are shown, where only the bright puncta correspond to TERRA transcripts (B). Graph shows the quantification of the mean number of TERRA spots in all developmental stages (mean+s.d., n=number of samples). (C) Zoom areas corresponding to the inner cell mass (ICM) and trophoectoderm (TE) are shown. (D) Graph represents the mean number of TERRA spots in the ICM and TE (mean+s.d., n=number of blastocysts). Total number of foci and nuclei used for the analysis are indicated. Scale bar: 10 μm. The Student’s t-test was used for all statistical analysis (*p<0.05, **p < 0.01, and ***p<0.001).