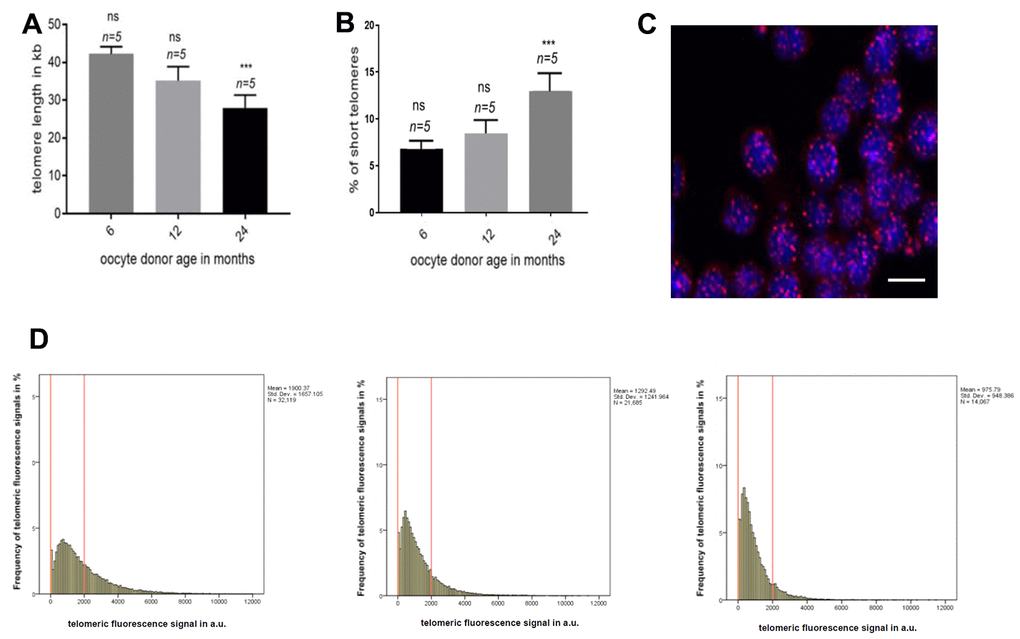
Figure 3.Telomere length in oocyte donor leukocytes. (A) Graph represents the quantification of the mean telomere length in the 6, 12 and 24 months old donors group by HT-Q-FISH (mean values ±s.e.m., n=number of blood samples in each group). (B) Graph showing the percentage of short telomeres in the same settings. Short telomeres are considered those in the 10% percentile of the total telomere length distribution (mean values ± s.e.m., n=technical replicates). (C) Representative confocal microscopy picture of oocyte donor leukocytes (blue=DAPI, red=telomeres, scale bar = 5um). (D) Representative frequency graphs of telomere length distribution in arbitrary units (a.u.) of intensity measured in the 6, 12 and 24 (from left to right) months old oocyte donors and the mean telomere length and the number of telomeres analyzed is shown. The red lines are arbitrary lines placed in the exact same position in each frequency graph to visualize differences between samples, the y-axis represents the frequency in percentage of telomere length distribution and the x-axis shows the telomeric fluorescence signal in a.u. . One-way ANOVA with Dunnett’s post test was used for the statistical analysis (*p<0.05, **p < 0.01, and ***p<0.001).