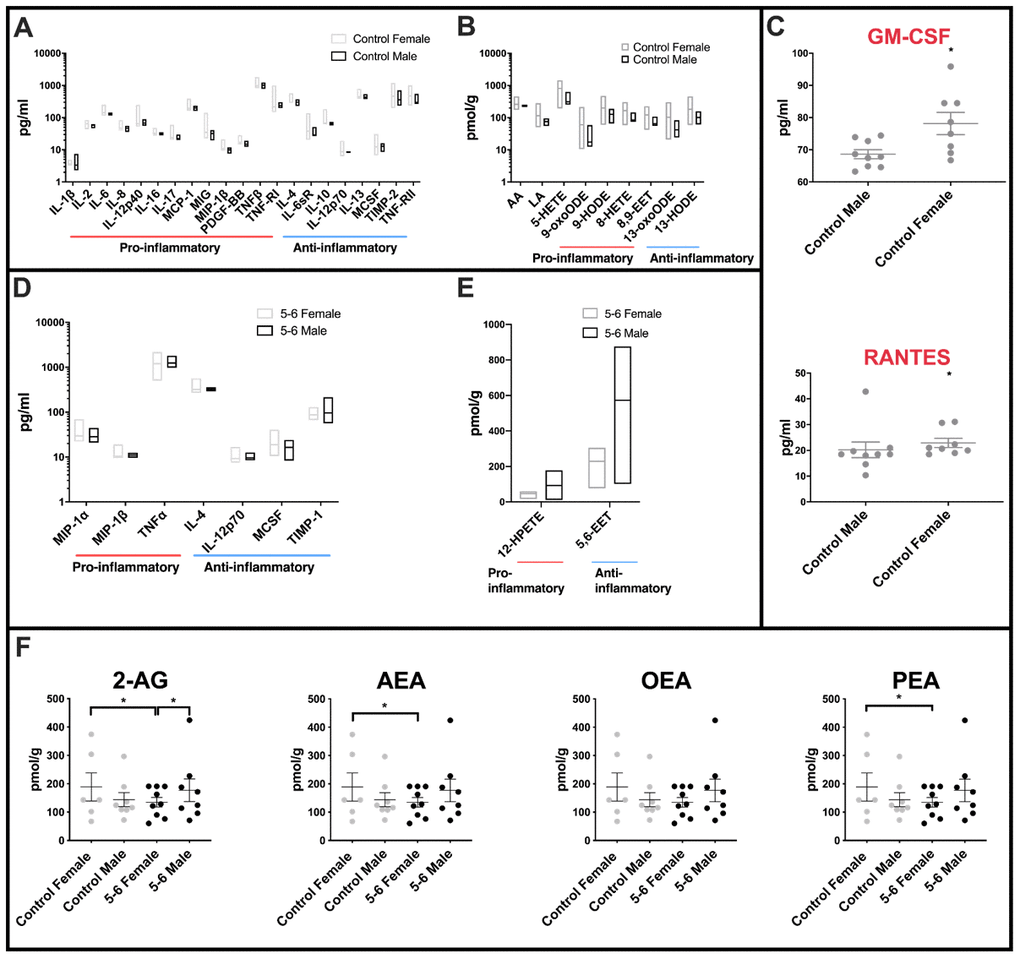
Figure 1.Sex differences in inflammatory profiles of cerebellar mitochondria. (A) Cerebellar mitochondria of female controls have highly variable inflammatory cytokine expression compared with male controls. Twenty-one inflammatory cytokines showed significantly different variance between female and male controls. Twenty of these were significantly more variant in females. Control male n=9; control female n=8. (B) Oxylipin variance is significantly greater in cerebellar mitochondria of female controls than male controls. Female controls have significantly greater variance in nine oxylipins. Male control cerebellar mitochondrial oxylipin levels are less variant within the group. Control male n=5; control female n=5. (C) Two inflammatory cytokines are significantly increased in female compared to male controls. RANTES and GM-CSF were significantly increased in mean levels in female controls compared to male controls. Control male n=9; control female n=8. (D) Cerebellar mitochondria from PD Braak 5-6 females have greater variability in inflammatory cytokine expression than the Braak 5-6 males. Six of seven significant inflammatory cytokines showed higher variance in the PD Braak 5-6 female group than PD Braak 5-6 males. PD Braak 5-6 male n=10; PD Braak 5-6 female n=9. (E) PD Braak 5-6 males and females show little variance in all but two cerebellar mitochondrial oxylipin levels. Two oxylipins have significantly higher variance values in PD Braak 5-6 males than females. PD Braak 5-6 male n=5; PD Braak 5-6 female n=5. All samples were age matched. A, B, D and E present inflammatory cytokine and oxylipins with significantly different variances (f-test). Refer to Supplementary Tables 4 and 6 for f values of oxylipins and inflammatory cytokines, respectively. Box plots display interleaved high and low. The horizontal line represents the mean. C shows significantly altered cytokines. Red title font represents pro-inflammatory cytokine. Displayed are mean levels ± SEM. (Mann-Whitney U-test). Refer to Supplementary Table 5 for p values. (F) Endocannabinoid variance is reduced in PD Braak 5-6 females. Female control group has heterogenous quantities of 2-AG, AEA and PEA compared with PD Braak 5-6 female group. Males do not show significant variation in endocannabinoid levels. Statistical analyses were carried out using GraphPad Prism (f-test). No significant differences were seen between the means of the groups (Kruskal-Wallis test with multiple comparison’s). Braak 5-6 male n=8; Braak 5-6 female n=9; control male n=8; control female n=6. All samples were age matched. Plots display mean ±SEM. Bars above plots represent statistically significant differences. Refer to Supplementary Table 7 for p and f values.