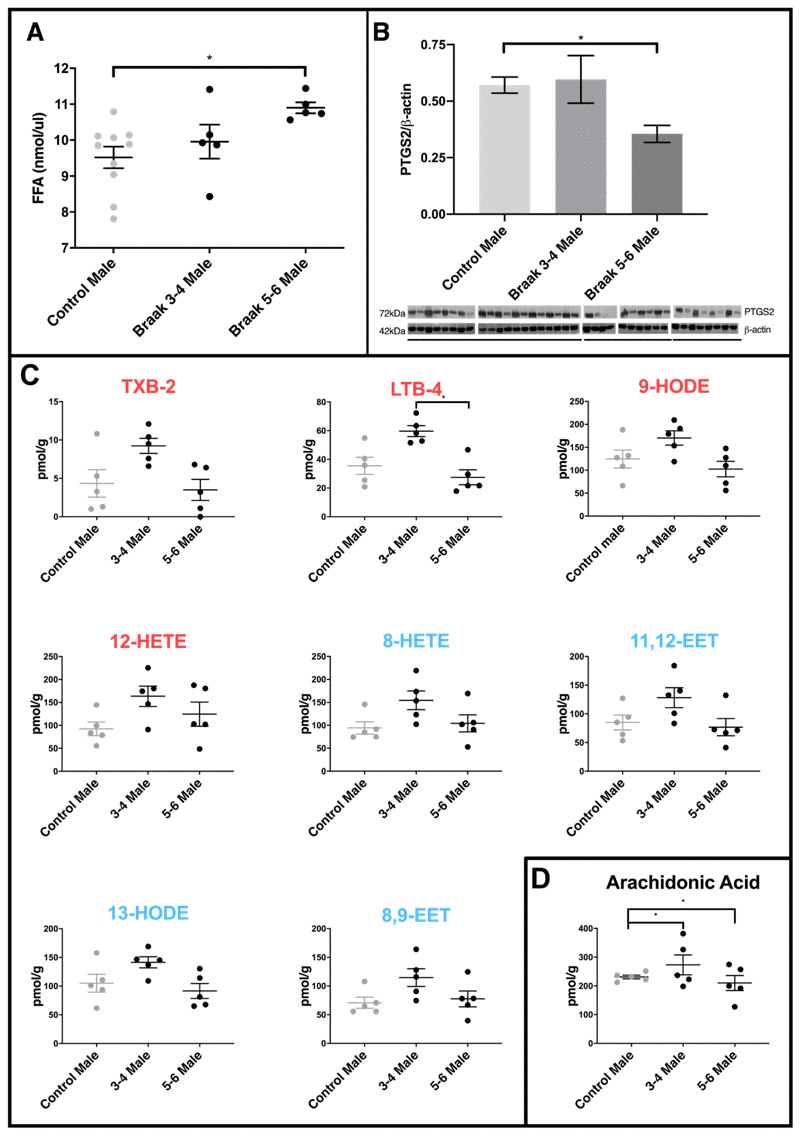
Figure 3.Comparison of PD cerebellar mitochondria with different Braak classification. (A) Free fatty acid concentration is increased in cerebellar mitochondria of PD Braak stage 5-6 males. A significant increase in FFA levels was shown in cerebellar mitochondria of Braak stage 5-6 males compared to age-matched controls (p=0.0164). No significant differences were apparent between PD Braak stage 3-4 and control. PD Braak 3-4 males (n=5), PD Braak 5-6 males (n=5), age-matched control males (n=10). Plots show mean values (nmol/μl) ± SEM (Kruskal-Wallis test with multiple comparisons). (B) Cerebellar levels of PTGS2 in PD Braak 5-6 mitochondrial fractions are lower compared with PD Braak 3-4 and controls. PTGS2 measured in enriched mitochondrial fractions were present in significantly lower quantities in the cerebellum of PD Braak 5-6 males compared to male controls (p=0.0307). No significant difference in PTGS2 levels were seen between PD Braak 3-4 and age-matched control. Mitochondrial PTGS2 levels, normalized to β-actin, were determined by Western blotting using mitochondrial and cytosolic fractions extracted from cerebellar tissue from age-matched male control (n=10) and PD Braak 3-4 (n=5) and 5-6 (n=4). Columns show the mean ±SEM (Kruskal-Wallis test with multiple comparisons). (C) Oxylipin concentrations in cerebellar mitochondria. LTB-4 is significantly decreased in PD Braak 5-6 males (n=5) compared to PD Braak 3-4 males (n=5); p=0.0139 (Kruskal-Wallis test with multiple comparisons). No significant differences were apparent between PD male groups and age-matched male controls (n=5). Red /blue titles represent pro- /anti-inflammatory, respectively. No significant changes were found between control males and PD Braak 5-6 males. Plots display mean concentration (pmol/g) ±SEM. Refer to Supplementary Table 5 for all p values (Kruskal-Wallis test with multiple comparisons). (D) Arachidonic acid levels in PD. Cerebellar mitochondrial arachidonic acid levels are similar in control males but significant variation is seen in PD Braak 3-4 and 5-6 males. Refer to Supplementary Table 4 for f values. All samples were age matched. PD Braak 3-4 male n=5; PD Braak 5-6 male n=5; control male n=5.
Figure 3 — Sex specific inflammatory profiles of cerebellar mitochondria are attenuated in Parkinson’s disease | Aging