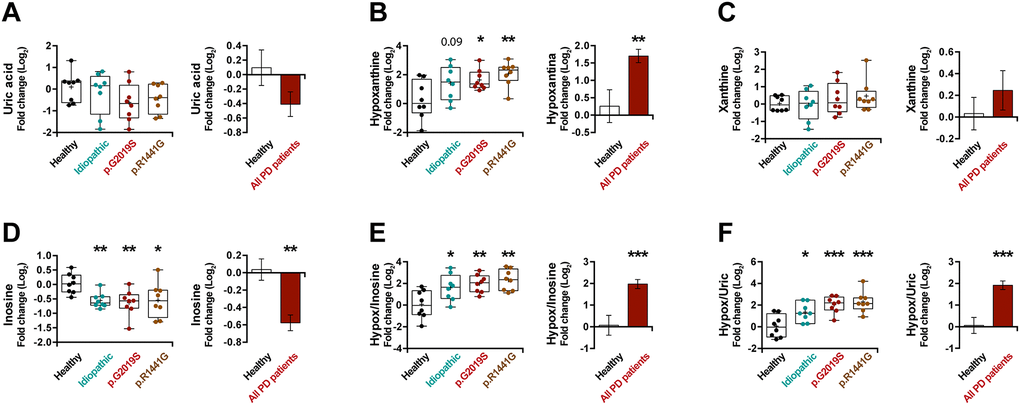
Figure 4.Box and whisker plots and graphs with average ± SEM of fold change (Log2) concentrations of uric acid (A), hypoxanthine (B), xanthine (C), inosine (D), hypoxanthine/inosine ratio (E) and hypoxanthine/uric acid ratio (F) in the control group (health), idiopathic and familial (carrying the p.G2019S or p.R1441G mutations in LRRK2) Parkinson’s disease (PD) patients.