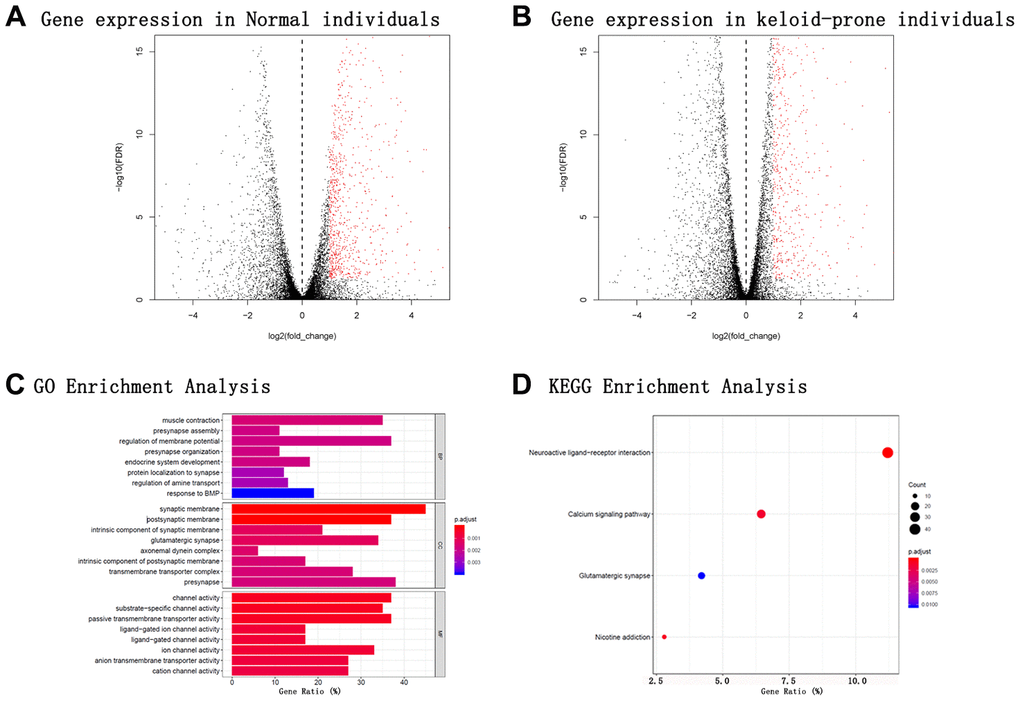
Figure 1.Volcano plots of mRNA expression in the two groups; GO and KEGG enrichment analyses of specific genes expressed in keloid-prone individuals. (A) mRNA expression in normal individuals. (B) mRNA expression in keloid-prone individuals. (C) GO enrichment analysis. (D) KEGG enrichment analysis. In A and B, the left side of the dashed line represents the uninjured state (day 0); the right side represents the injured state (day 42).