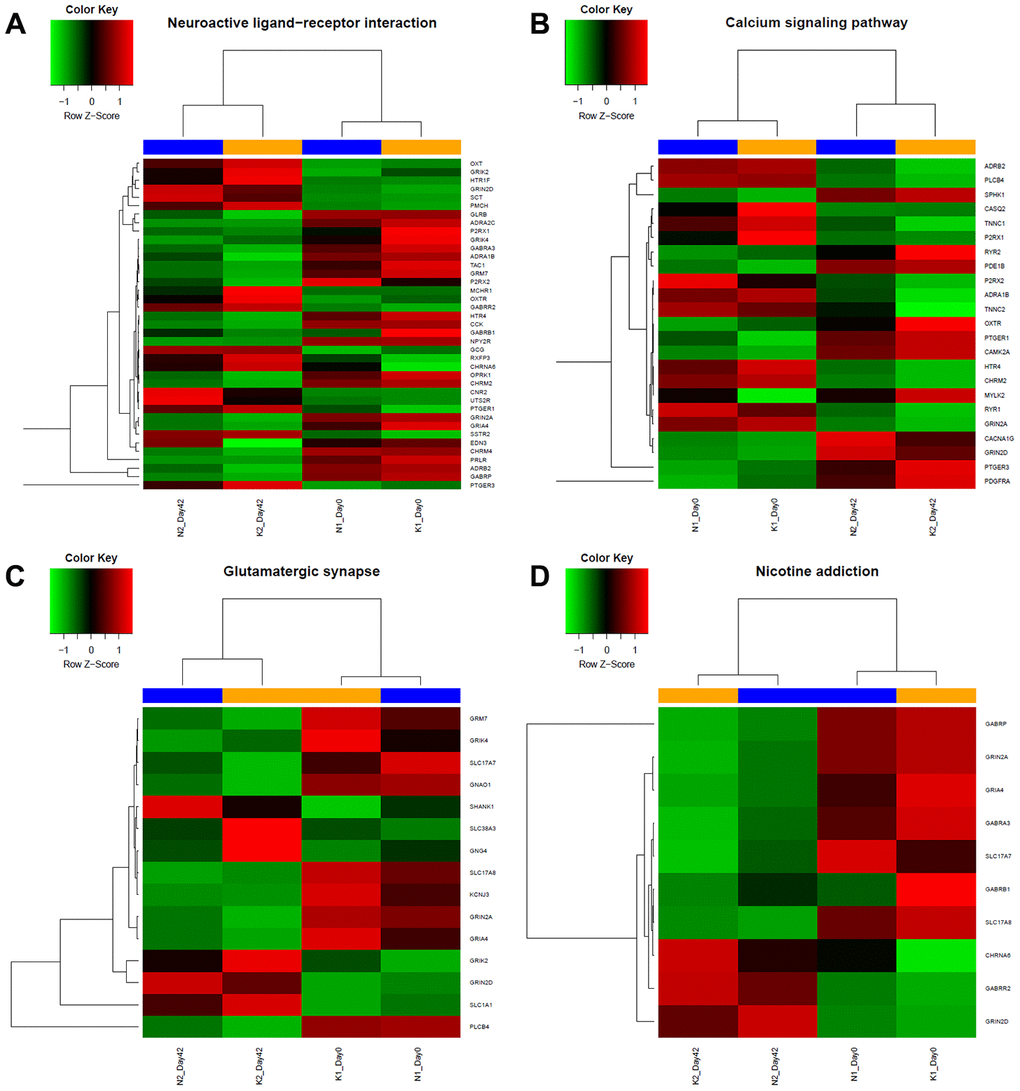
Figure 2.Heatmap of specific gene expression in different groups form 4 different KEGG enrichment pathway categories. According to results from KEGG analysis, expression level of genes of each group from (A) Neuroactive ligand-receptor related pathways, (B) Calcium signalling related pathway, (C) Glutamatergic synapse related pathway and (D) Nicotine addiction related pathway were shown. Red indicates upregulation; green indicates downregulation; blue indicates the normal group, including day 0 and day 42; yellow indicates keloid-prone individuals, including day 0 and day 42.