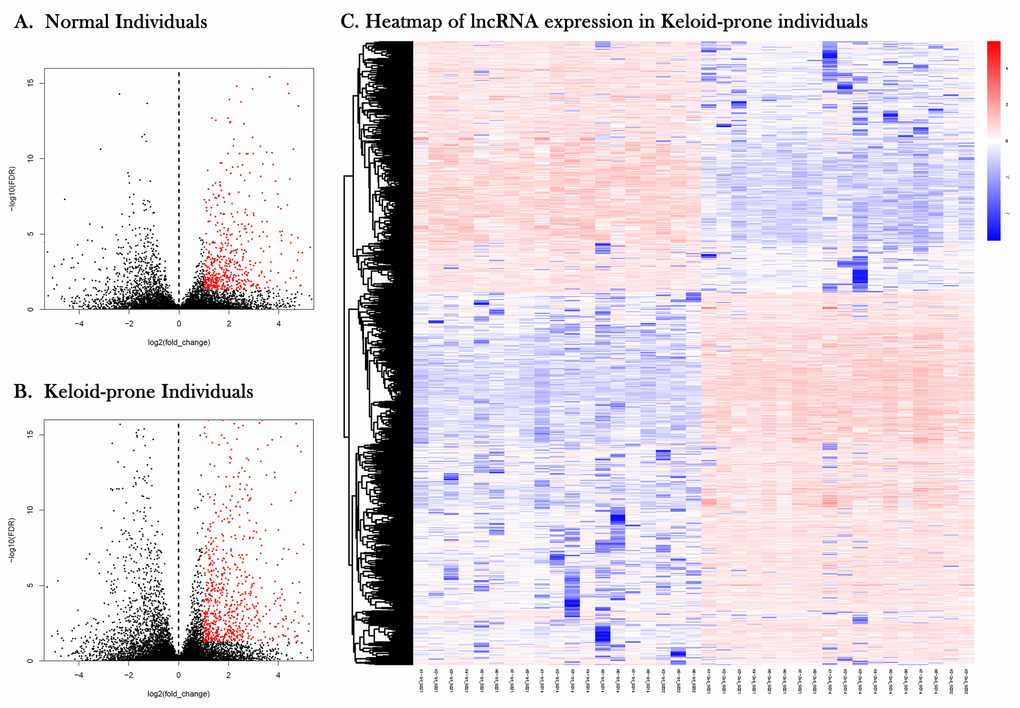
Figure 3.Volcano plots and heatmap of lncRNA expression in keloid-prone individuals. (A) lncRNA expression in normal individuals. (B) lncRNA expression in keloid-prone individual group. In A and B, the left side of the dashed line represents the uninjured state (day 0); the right side represents the injured state (day 42). (C) Heatmap of lncRNA expression before and after injury in Keloid-prone groups.