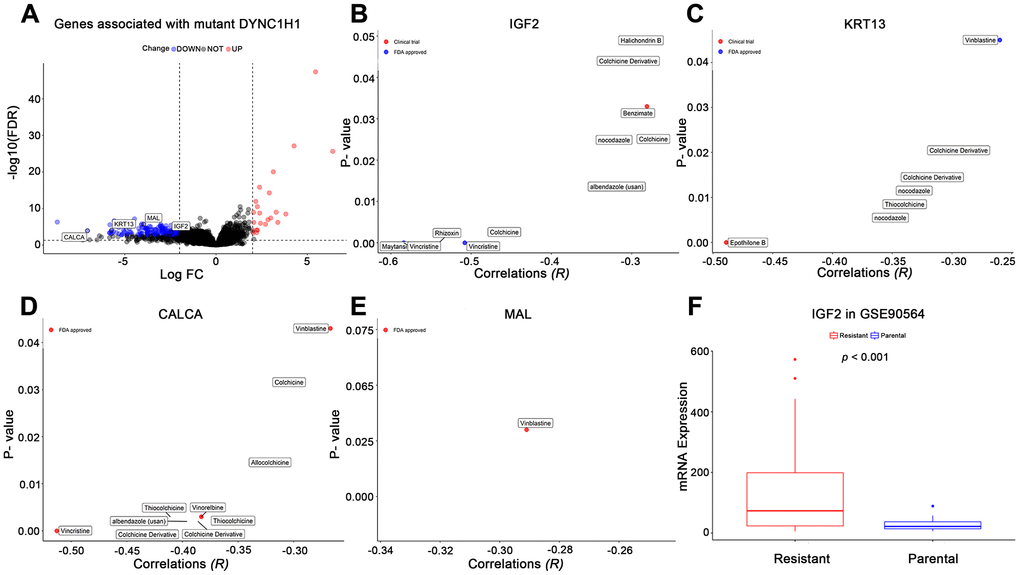
Figure 6.Effects of mutant DYNC1H1 on enhanced microtubule inhibitors (MTIs) activities. (A) Volcano plot for the DEGs between DYNC1H1 mutated and wild type gastric cancer patients in TCGA-STAD cohort. The x-axis represented log2 (fold change): mutant DYNC1H1 compared with wild type patients, and the y-axis represented significant difference as −log10(FDR). The criteria of FDR <0.05 and |log2FC| ≥ 2 were considered significant by the function TCGAbiolinks_DEA of TCGAbiolinks. (B–E) Correlations between MTIs activities and mRNA expressions of IGF2, KRT13, CALCA, and MAL in NCI-60 cell lines dataset, respectively. P-value estimated using Pearson’s correlation. The x-axis represented the correlation coefficient, and the y-axis showed the significance (−log10 p-value). (F) Histograms depicting different mRNA expressions of IGF2 between MTIs sensitive and resistant cell lines in GSE90564 dataset. P-value estimated using Student’s t-test. P-value <0.05 was considered significant.