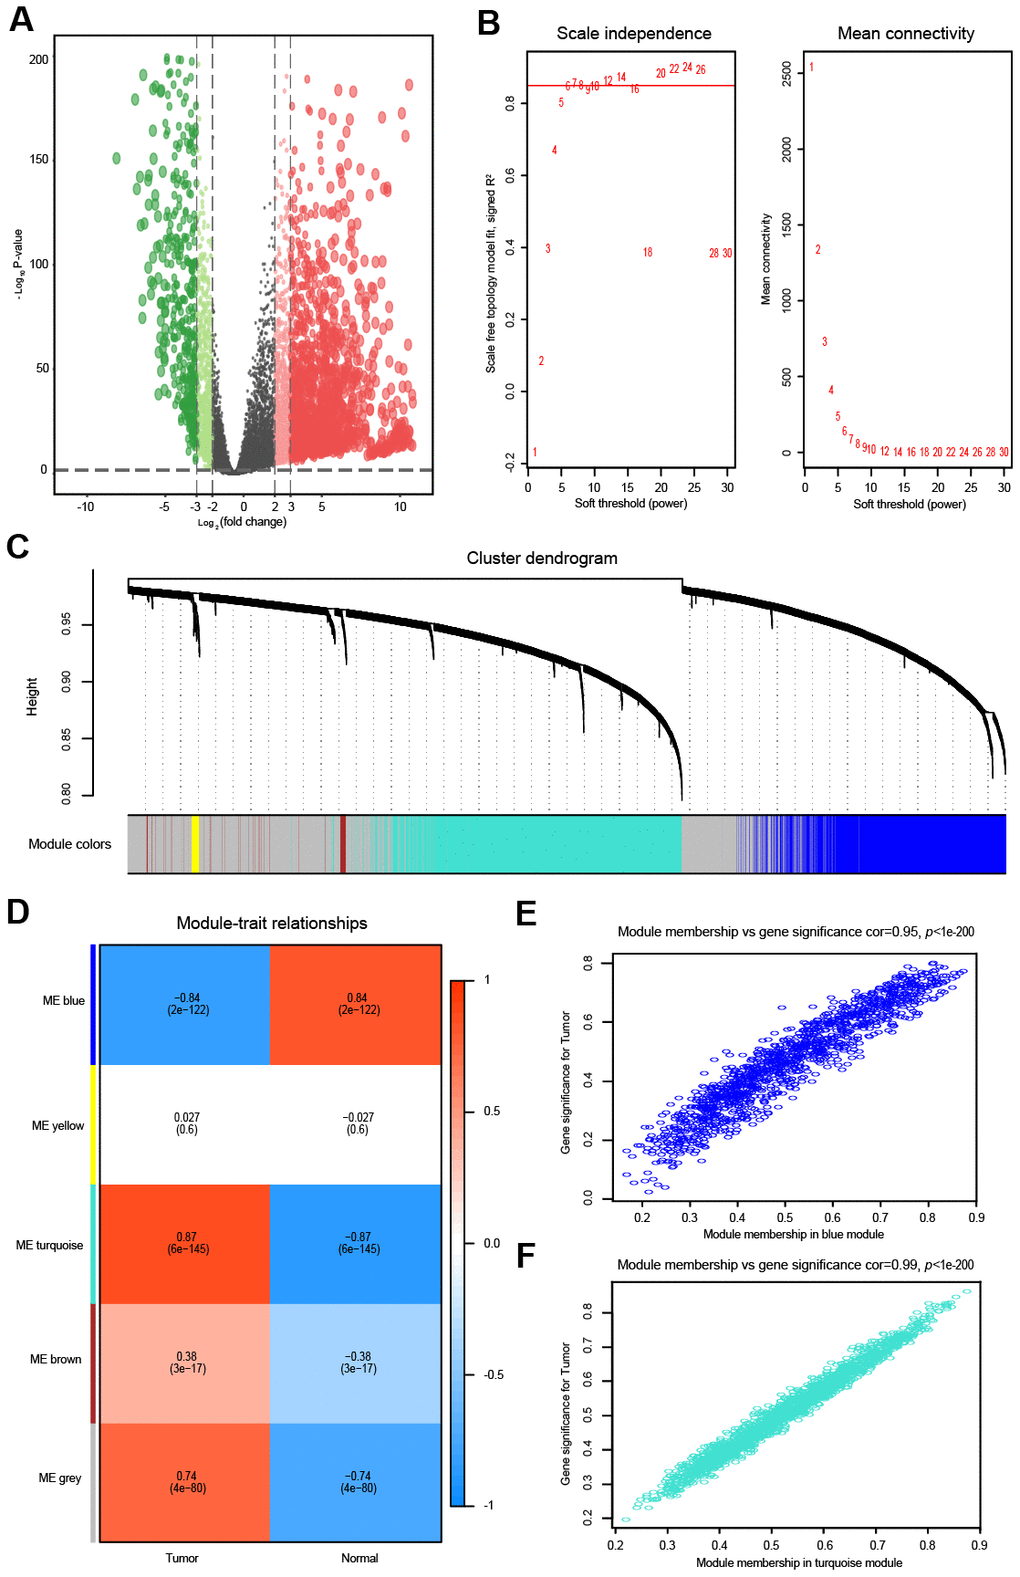
Figure 1.Differential expression analysis and weighted correlation network analysis for the lncRNAs. The volcano plots of differentially expressed lncRNAs. The green dots indicate significantly downregulated genes, the red dots indicate significantly upregulated genes, while the black dots indicate genes with no significant difference. (A) Identification of the soft threshold according to the standard of the scale-free network. The red line represents the threshold line of 0.85. (B) Clustering dendrogram of lncRNAs with dissimilarity based on the topological overlap together with assigned module colors. (C) Relationships between lncRNA modules and clinical traits. The correlation coefficient (upper number) and the corresponding P-value (lower number) in each cell resulted in the correlation between the lncRNA module and the clinical trait. (D) The scatterplot of gene significance vs. module membership in the lncRNA-based blue module. (E) The scatterplot of gene significance vs. module membership in the lncRNA-based turquoise module. (F) The scatterplot of gene significance vs. module membership in the lncRNA-based blue module.