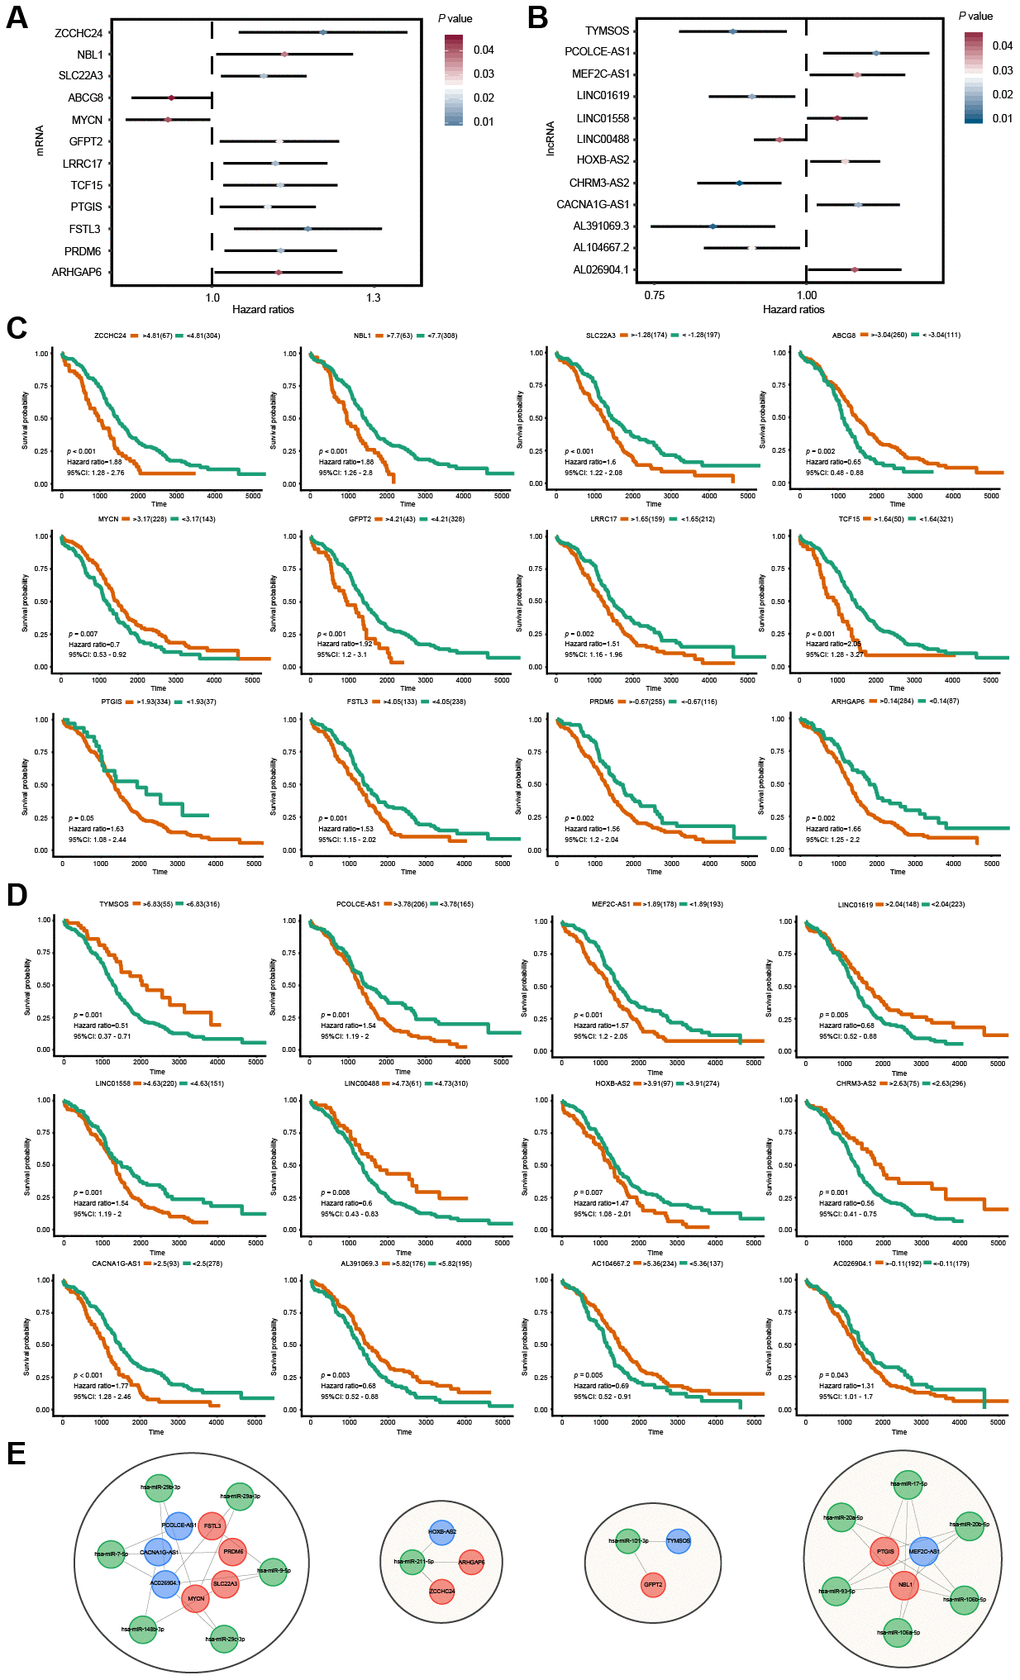
Figure 5.Survival analysis for lncRNAs and mRNAs in the ceRNA network. (A, B) Forest plots of hazard ratios (HR) of survival-associated mRNAs and lncRNAs in the ceRNA regulatory network. (C, D) Kaplan-Meier survival curves for mRNAs and lncRNAs. The horizontal axis indicates the overall survival time in days, and the vertical axis shows the survival rate. (E) The OS-specific ceRNA sub-network. The lncRNAs, miRNAs and mRNAs are indicated as blue, green and red, respectively.