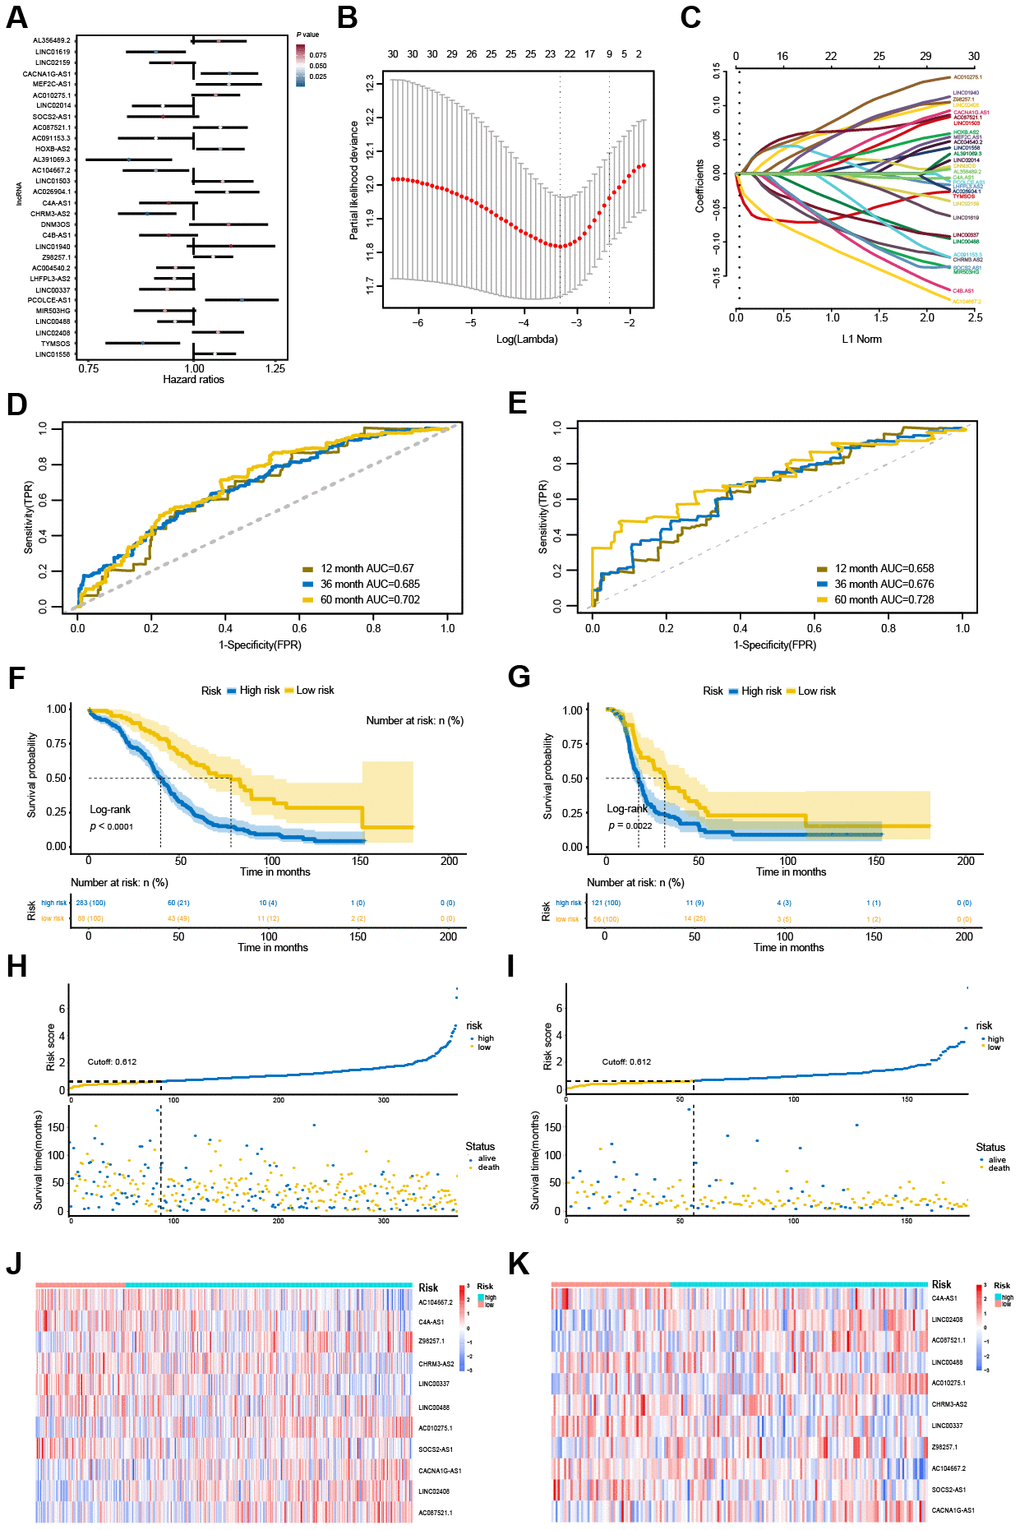
Figure 6.Identification and performance evaluation of the 11-lncRNA signature. (A) Forest plots of hazard ratios (HR) of the 30 potential OS-associated lncRNAs.(B) Selection of the tuning parameter (lambda) by ten-fold cross-validation based on the minimum criteria for OS. (C) The coefficient profiles of the 30 potential OS-associated lncRNAs at varying levels of penalty. (D, E) The time-dependent ROC curves of the 11-lncRNA signature in predicting OS and DFS. (F, G) Kaplan-Meier curves of patients with low or high risk in the TCGA-OS cohort and TCGA-DFS cohort. (H, I) Risk score distribution and survival status of patients in the TCGA-OS cohort and TCGA-DFS cohort. (J, K) RNA expression heat map of the 11 prognostic signature between low-risk and high-risk groups in the TCGA-OS cohort and TCGA-DFS cohort.