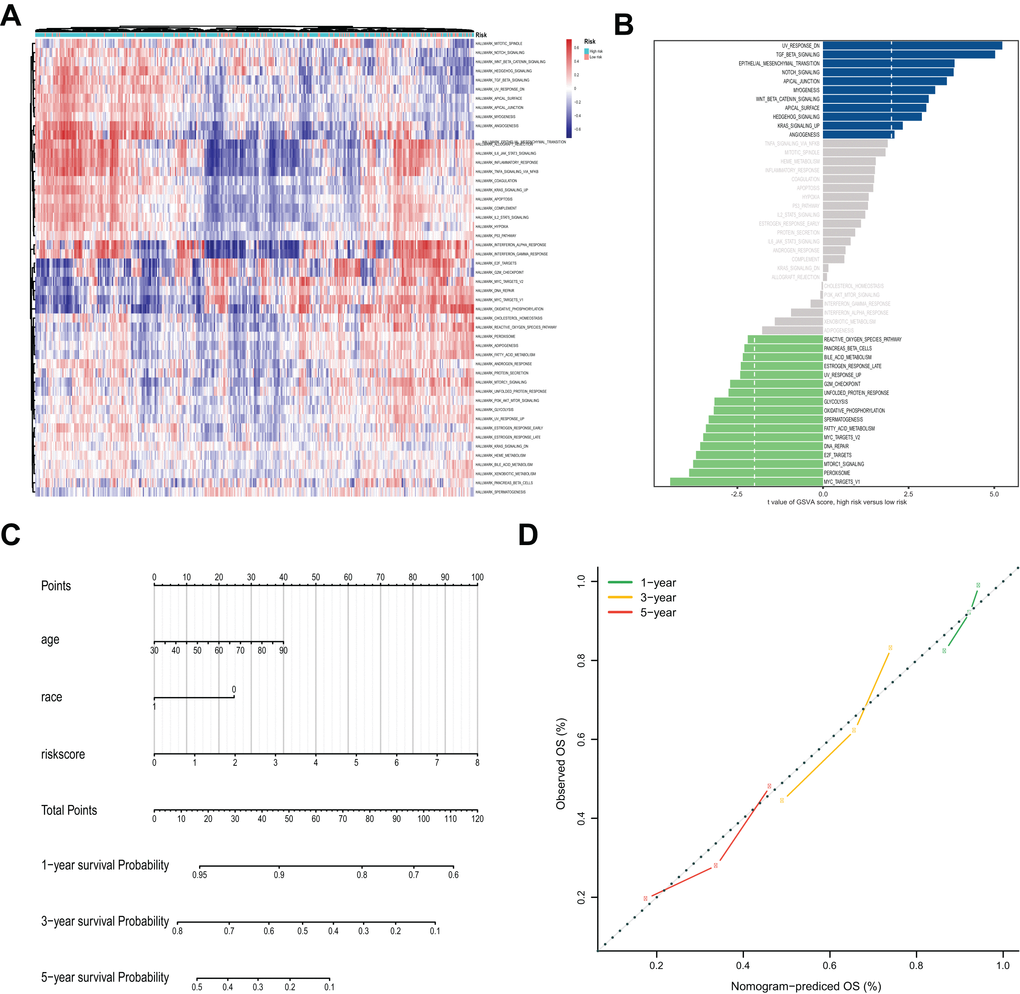
Figure 8.Gene Set Variation Analysis (GSVA) analysis and nomogram for the prediction of prognosis. (A) The heatmap of GSVA scores of the 50 key pathways between high-risk and low-risk groups. (B) Differences in pathway activities scored by GSVA between high-risk and low-risk groups. The blue column indicates activated pathways in the high-risk group, and the green column indicates activated pathways in the low-risk group. (C) Nomogram prediction of 1-year, 3-year and 5-year OS. For race, 0 means white, and 1 means not white. (D) Calibration curves of observed and predicted probabilities for the nomogram.