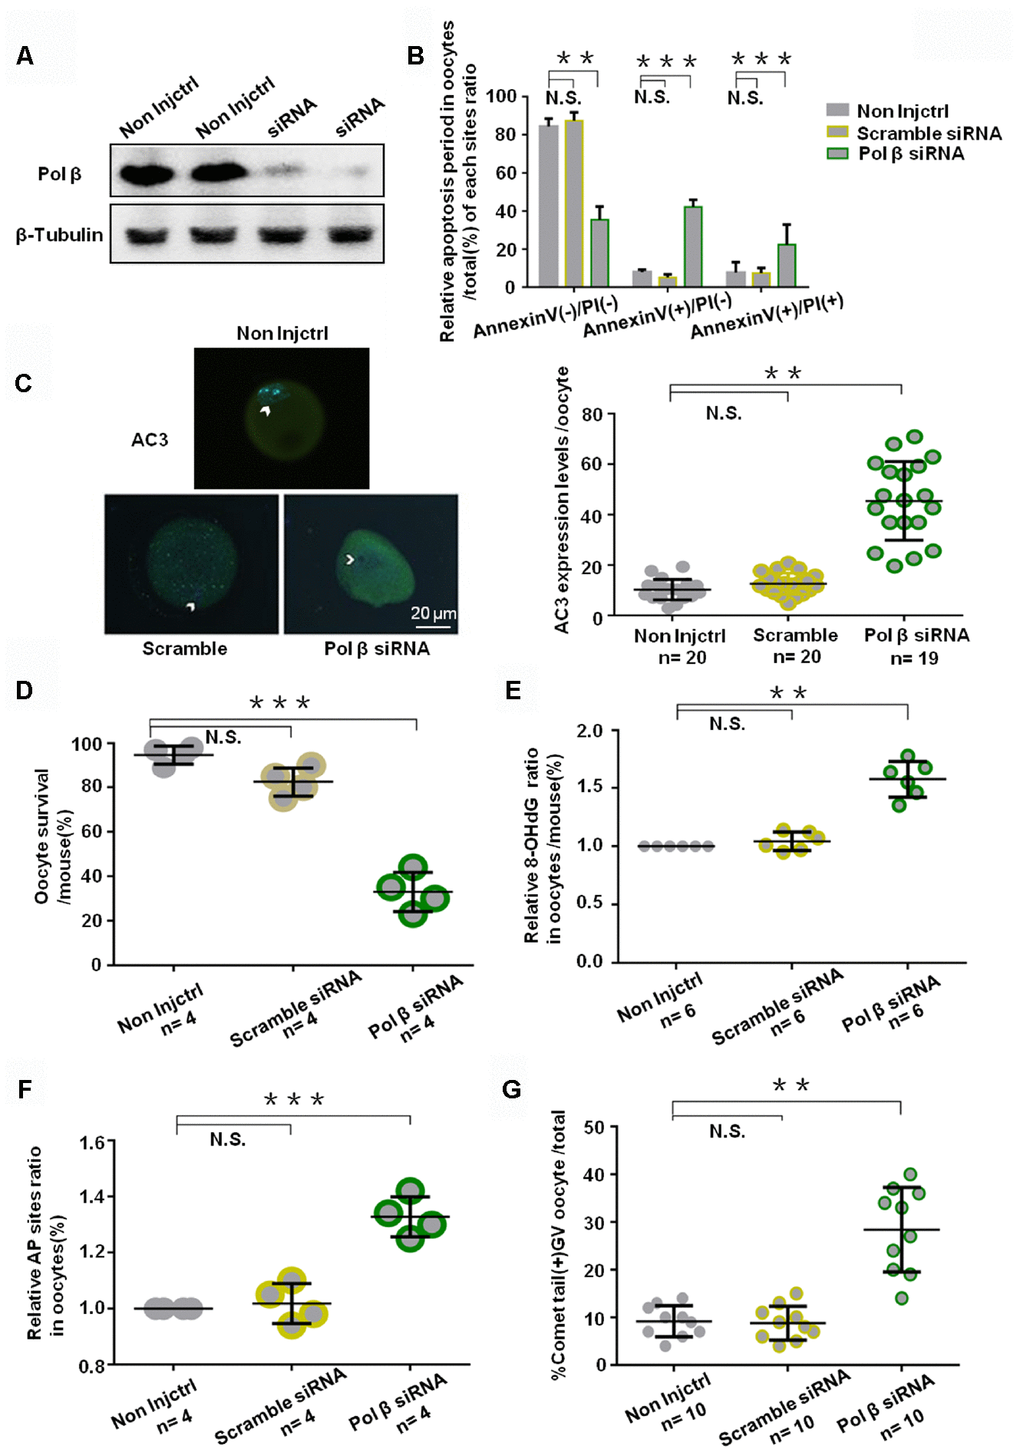
Figure 4.Effects of Pol β knockdown on oocytes apoptosis. (A) Western blotting analysis indicates that Pol β siRNA group have barely expression. (B) Bar graphs show a result with Annexin V/PI staining. Statistics of oocytes number per non-Injctrl/ Scramble siRNA/ Pol β siRNA oocytes including Annexin V(-)/PI(-), AnnexinV(+)/PI(+) and Annexin V(+)/PI(-). Bar graphs show Pol β siRNA group more Annexin V(+)/PI(-), more Annexin V(+)/PI(+), and less Annexin V(-)/PI(-) compared to non Injctrl/ Scramble siRNA group, (n=4 per group; n stands for the number of mice, ***P<0.001; ***P<0.001; **P<0.01, respectively). (C) Impact of siRNA silencing of Pol β on genomic integrity and survival of mouse oocytes in response to genotoxic stress. In response to H2O2 treatment (250 μM), AC3 levels were higher (n stands for the number of oocytes, **P < 0.01, Student’s t test). Photomicrographs are representative of the AC3 levels in the siRNA-silenced oocytes: scramble, Pol β (green). Arrowheads show the nuclear region. Oocytes are counterstained with DAPI (blue). (D) Survival was lower in the oocytes in which the expression of Pol β had been silenced compared to those in controls (scramble siRNA) (n stands for the number of mice, ***P < 0.001). (E) Scatter graphs represent the 8-OHdG in oocytes, with a significant increase in Pol β siRNA oocytes compared to that in non-Injctrl/ scramble siRNA oocytes (n=6 per group; n stands for the number of mice, **P<0.01). (F) Scatter graphs represent the relative ratio of AP sites in oocytes, with a significant increase in Pol β siRNA oocytes compared to that in non-Injctrl/ scramble siRNA oocytes (n stands for the number of mice, ***P<0.001, Student’s t test). (G) Scatter graphs represent the percentage of positive comet tail in oocytes, with a significant increase percentage of positive comet tail in Pol β siRNA oocytes compared to that in non-Injctrl/ scramble siRNA oocytes (n stands for the number of mice, **P<0.01, Student’s t test). Each experiment was repeated three times. All graphs show the means ±SD.