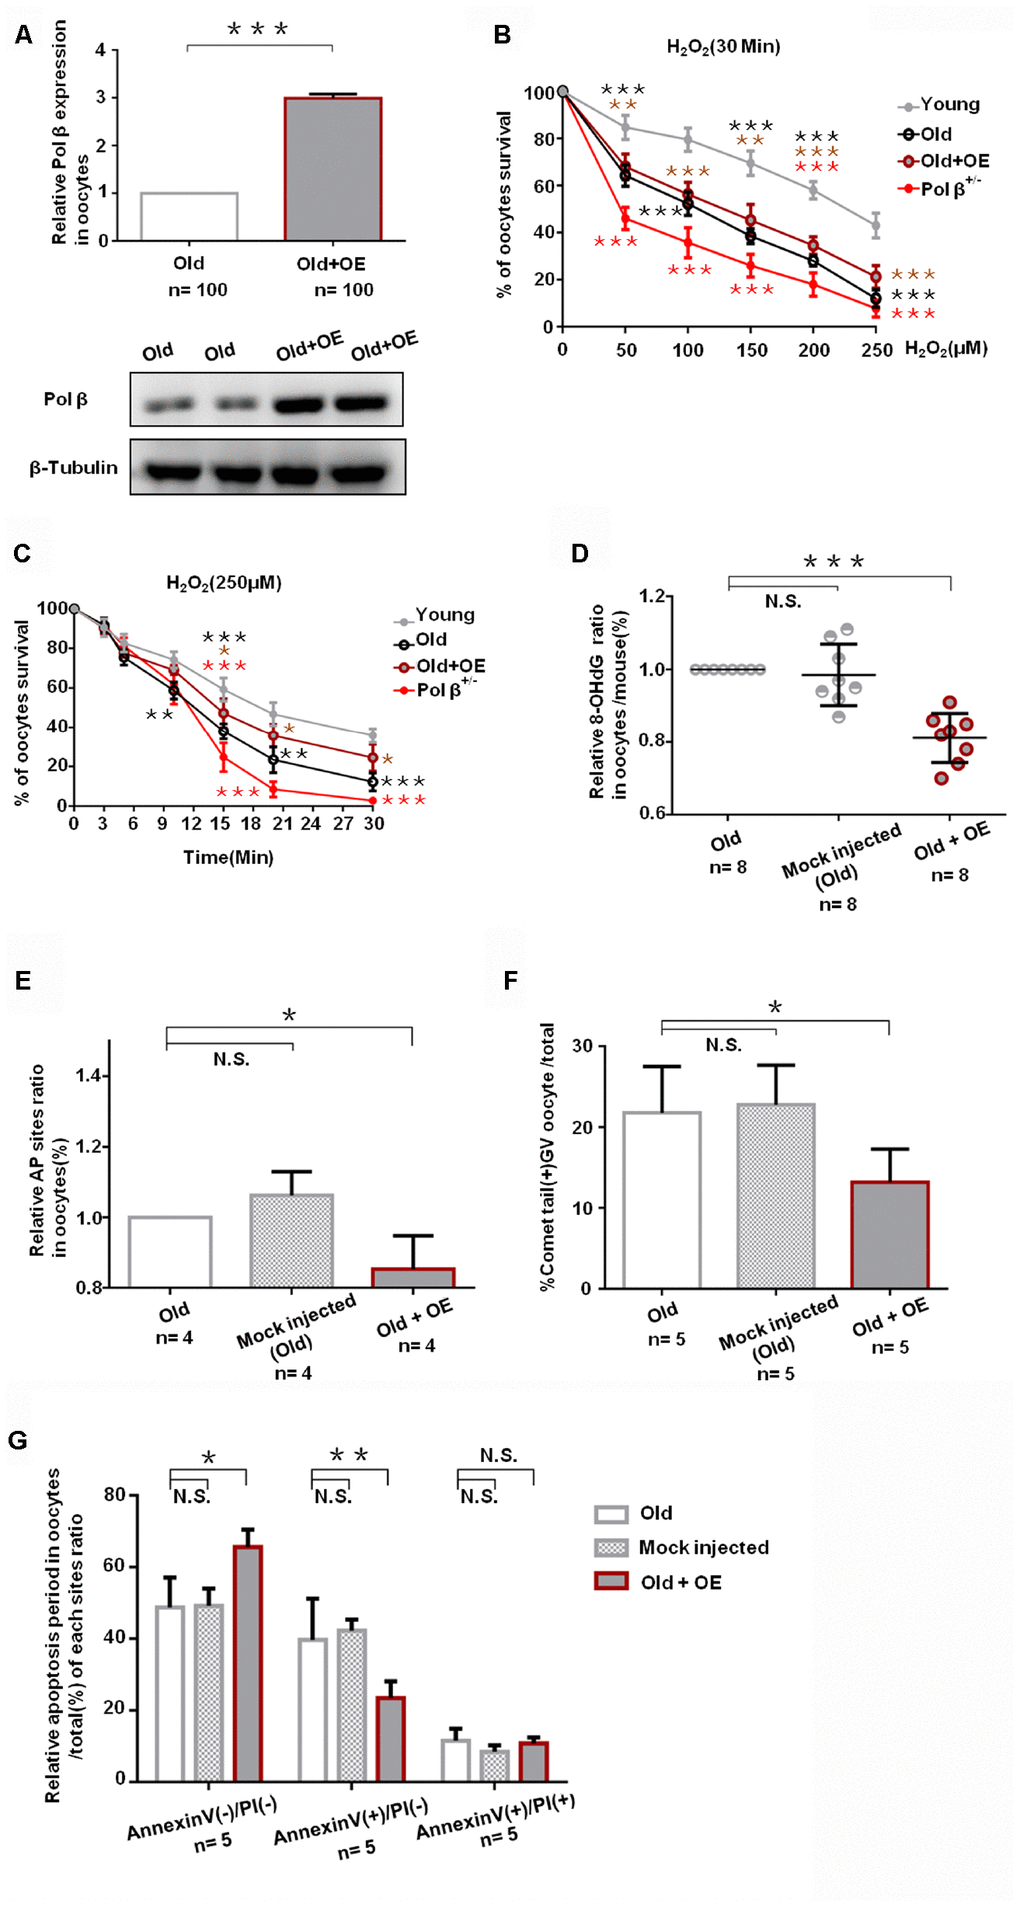
Figure 5.Pol β overexpression ameliorates maternal age-associated ovarian reserve exhaustion. (A) Relative Pol β gene expression levels in Pol β OE. We observed significant Pol β expression increase compared to old mice by WB and QPCR (mice aged 8 months, n stands for the number of oocytes, ***P<0.001, Student’s t test). (B) Microinjection of the Pol β plasmid in response to genotoxic stress. Compared to wt (6-8 weeks), wt (8 months) / Pol β OE (8 months) / Pol β+/- (6-8 weeks) oocyte after treatment with different H2O2 concentrations at 30 minutes exhibited different survival. We observed a significant increase in survival in overexpressed oocytes compared to old mice (***P<0.001, Student’s t test). (C) Microinjection of the Pol β plasmid in response to genotoxic stress. Compared to wt (6-8 weeks), wt (8 months) / Pol β OE (8 months) / Pol β+/- (6-8 weeks) oocyte after treatment with the same H2O2 concentration exhibited different survival. We observed a significant increase in survival in overexpressed oocytes compared to old mice (*P<0.05, Student’s t test). (D) Scatter graphs represent the 8-OHdG in oocytes, with a significant decrease in Pol β OE oocytes compared to that in old/ mock injected oocytes (n=8 per group; n stands for the number of mice, ***P<0.001). (E) Bar charts represent the relative ratio of AP sites in oocytes, with a significant decrease in Pol β OE oocytes compared to that in old/ mock injected oocytes (n stands for the number of mice, *P<0.05, Student’s t test). (F) Bar charts represent the percentage of positive comet tail in oocytes, with a significant decrease percentage of positive comet tail in Pol β OE oocytes compared to that in old/ mock injected oocytes (n stands for the number of mice, *P<0.05, Student’s t test). (G) Bar charts show an result with Annexin V/PI staining. Statistics of oocytes number per old/ mock injected/ Pol β OE oocytes including Annexin V(-)/PI(-), AnnexinV(+)/PI(+) and Annexin V(+)/PI(-). Bar charts show Pol β OE oocytes more Annexin V(-)/PI(-), and less Annexin V(+)/PI(-) compared to that in old/ mock injected oocytes except Annexin V(+)/PI(+) (n=5 per group; n stands for the number of mice, *P<0.05; **P<0.01, respectively).