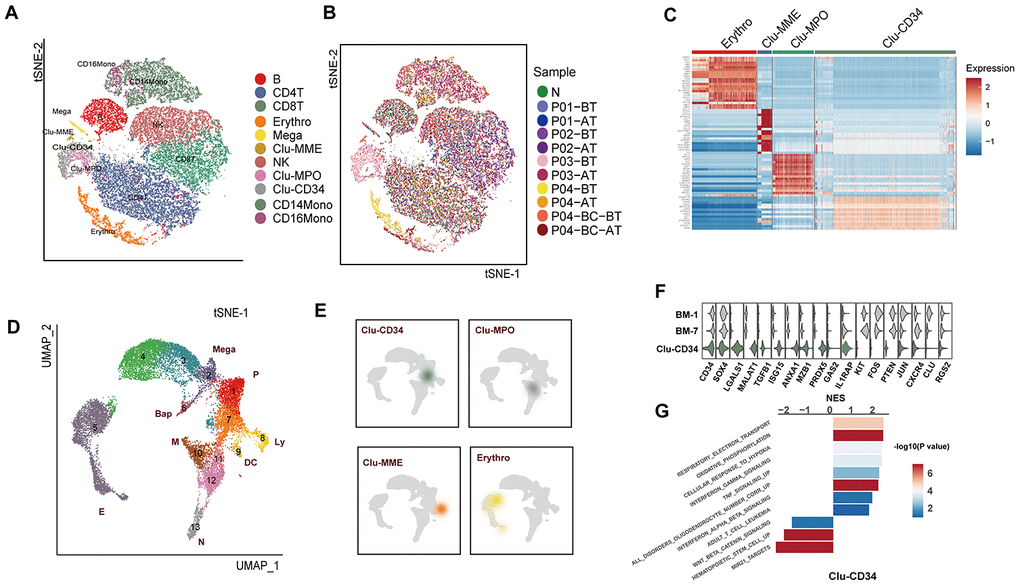
Figure 1.Comparison of the primitive stem/progenitor populations in peripheral blood with the healthy BM components. (A) TSNE plot for the resultant 11 clusters identified based on single cell RNA sequencing. The total number of cells is 41,723. Clusters are highlighted by different colors, and the number of cells in each cluster is listed in Supplementary Table 2. (B) TSNE plot of all cells. Colors indicate sample origin. (C) Heatmap showing the expression profiles of the four primitive clusters identified in peripheral blood. Expression of the scaled value of the top 30 significant marker genes in each cluster are shown. (D) UMAP plot displaying the resultant clusters identified in healthy Lin- bone marrow datasets [15]. The total number of cells is 15,253. Colors indicate clusters, and lineage destinations are labeled. P, early progenitor cells; Meg, megakaryocytes; (E) erythroid cells; BaP, basophil progenitors; N, neutrophils; M, monocytes; DC, dendritic cells; Ly, lymphoid cells. (E) Kernel density plot showing the projection result of the four primitive clusters identified in peripheral blood onto the BM reference map. (F) Violin plot showing the expression distribution of selected genes in Clu-CD34 in comparison with BM-1 and BM-7. (G) Bar plot displaying the GSEA result on the ordered expression profiles in Clu-CD34. X-axis indicates the normalized enrichment score (NES) and colors indicate the -log10(P value).