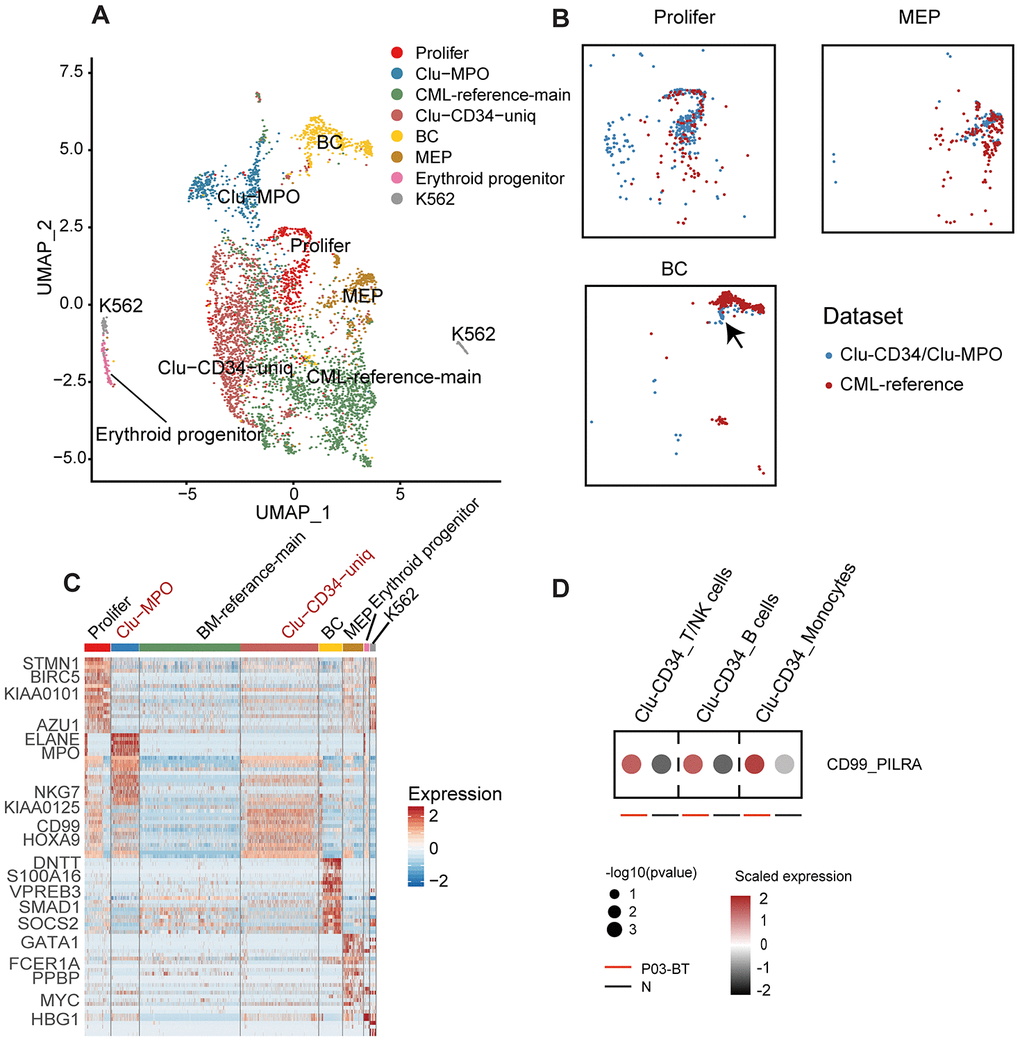
Figure 2.Comparison of Clu-CD34 and Clu-MPO with bone marrow CML datasets. (A) UMAP plot showing the clustering result of the integrated datasets comprising Clu-CD34, Clu-MPO and the BM-reference [13]. The total number of cells is 4,603 (Clu-CD34: 1,789; Clu-MPO: 527; BM-reference: 2,287). (B) UMAP plots of cells. Colors indicate dataset origin. Arrow in the lowest panel indicates the mixture of cells from the Clu-CD34 (n = 61) clustered together with BC cells from the BM-reference. (C) Heatmap showing expression of marker genes across different subtypes from the integrated dataset. Two specific subtypes from our dataset (absent in the BM-reference) are marked as red at top. (D) Dot plots comparing the interaction of the CD99-PILRA ligand-receptor pair between P03-BT and N. The p value was calculated using a permutation test.