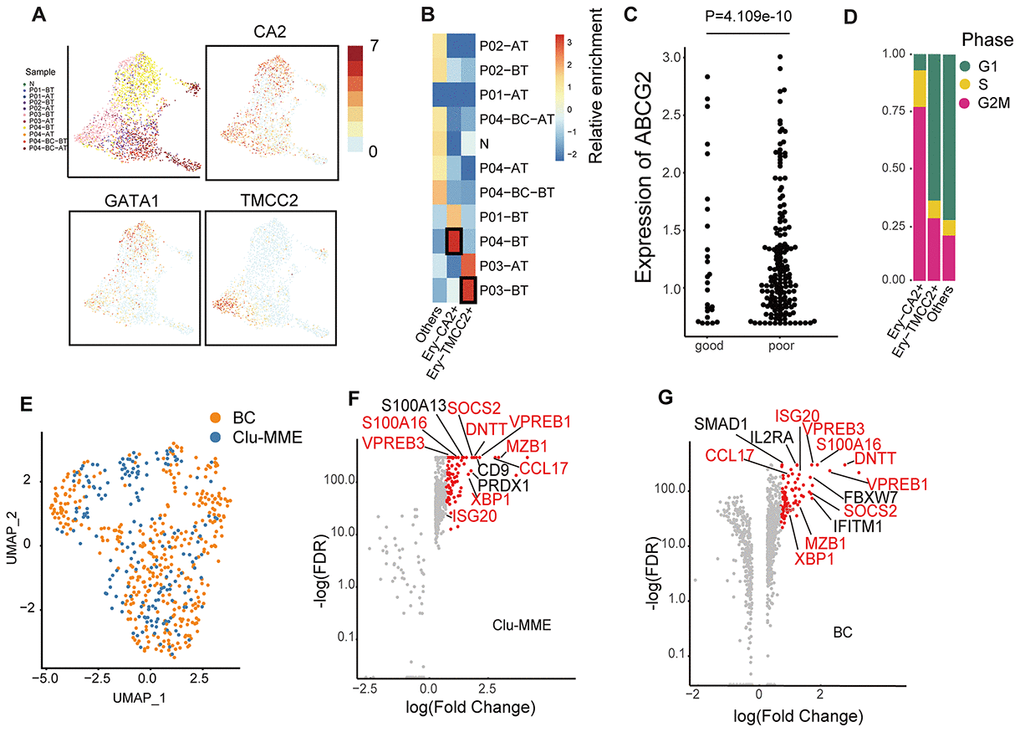
Figure 3.Comparison of erythrocytes and Clu-MME with bone marrow CML datasets. (A) UMAP plot presenting the re-clustering result of erythrocytes. Cells are highlighted with colors indicating sample origin. The expression of GATA1, CA2 and TMCC2 are indicated. The CA2- and TMCC2-expressing erythrocytes are separately enriched in P04-BT and P03-BT. (B) Heatmap showing enrichment of samples in each erythroid cluster. Enrichment score was calculated using the Fisher’s exact test and indicated by log10(Odd Ratio). (C) Beeswarm plots showing the expression of ABCG2 between good responders (P01 and P02) and poor responders (P03 and P04). P= 4.109e-10, unpaired t test. (D) Bar plots showing the fraction of cells from different cell cycle phases across different erythrocyte subtypes. (E) UMAP plot showing the integration result of the BC cluster (from the integrated dataset shown in Fig. 2a) and Clu-MME (the numbers of cells in the BC cluster and Clu-MME are 370 and 183, respectively). (F) Scatter plot showing the highly-expressed marker genes in Clu-MME (left) and the BC cluster (right). Significant markers (FDR<0.05, fold change > 2) are shown as red dots. The name of shared marker genes of these two clusters are indicated in red. (G) Heatmap comparing the expression profiles of CD16+ monocytes across different samples. The selected marker genes are indicated.