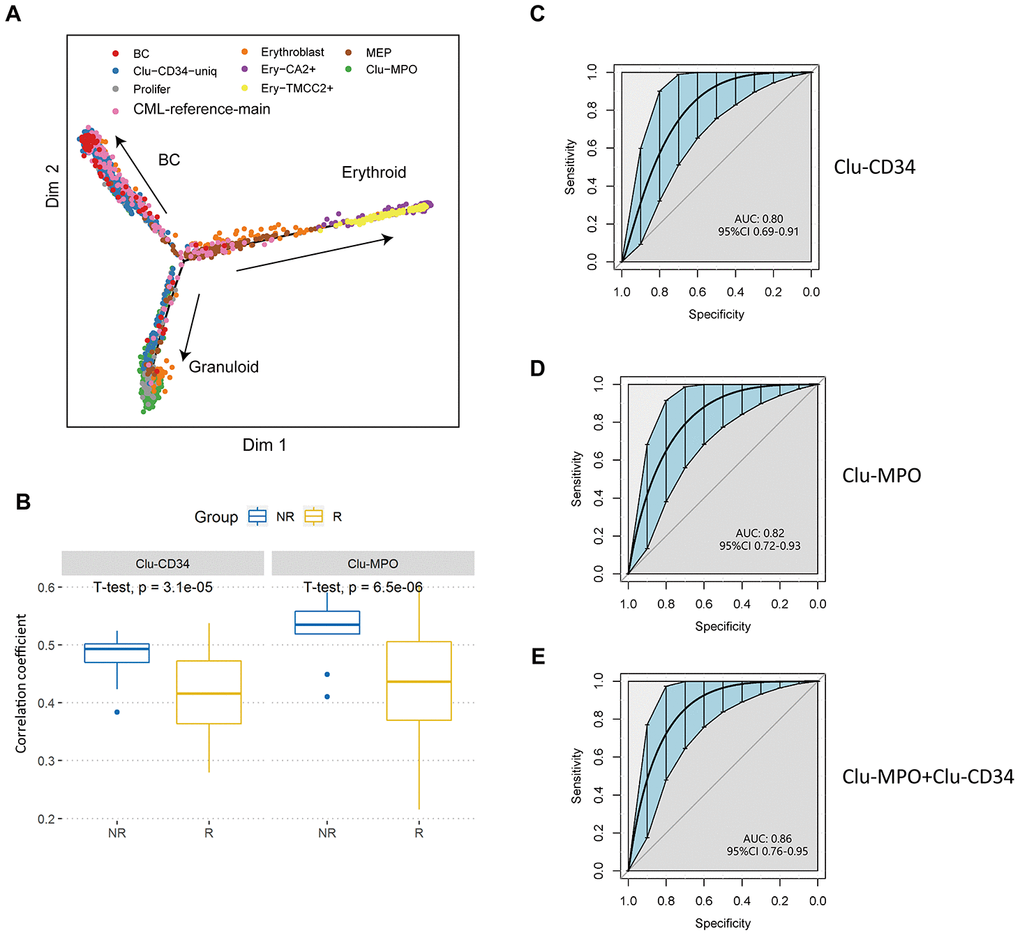
Figure 4.Validation of prognostic cell populations in 59 CML patients treated with imatinib. (A) Pseudotime trajectory of the primitive cells in peripheral blood. Cells are colored based on their identities in the integrated datasets with CML-reference or the erythroid clusters. (B) Box plots comparing the correlation coefficients of Clu-CD34 (left) and Clu-MPO (right) between 13 imatinib nonresponders (NR) and 83 responders (R) from GSE130404. The correlation coefficients were calculated using Pearson correlation of gene expression signatures of these two clusters with the gene expression profile in each CML patient treated with imatinib (see Methods). (C, D) ROC curves illustrating the classification performance of Clu-CD34 (c) and Clu-MPO (d) gene expression signatures of 13 imatinib nonresponders and 83 responders from GSE130404. The blue shade denotes the 95% confidence interval of the sensitivity at a given specificity point. AUC, area under the ROC curve are indicated. e) We integrated Clu-CD34 and Clu-MPO clusters together to predict imatinib resistance. ROC curves illustrating the classification performance of gene expression signatures of 13 imatinib nonresponders and 83 responders from GSE130404. The blue shade denotes the 95% confidence interval of the sensitivity at a given specificity point. AUC, area under the ROC curve are indicated.