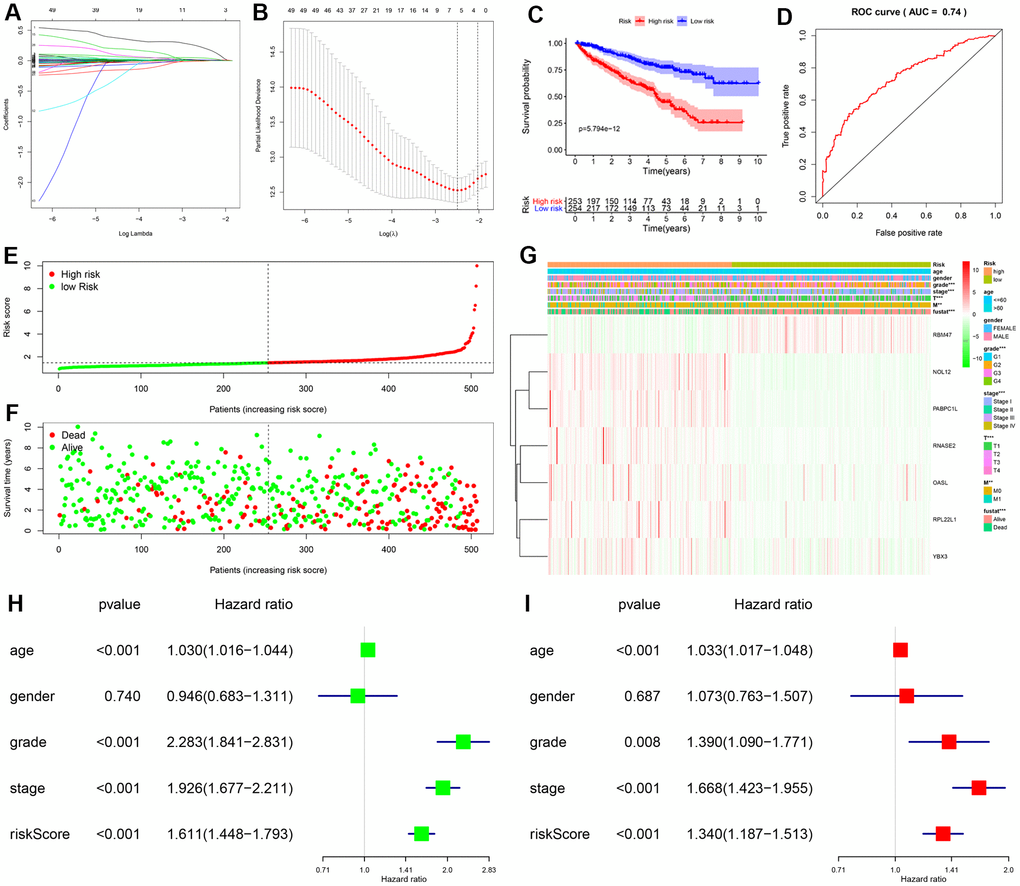
Figure 3.Construction and validation of prognostic risk score for KIRC patients. (A, B) Selection process for target RBPs using LASSO Cox regression analysis. (C) Kaplan-Meier curve showing that OS is significantly shorter for patients in the high-risk group than those in the low-risk subgroup. (D) ROC curve analysis showing the veracity and reliability of the prognostic model. (E) Risk score distributions. (F) Scatter plot showing the distribution of survival status and survival time. (G) Grade, AJCC stage, T stage, M stage, and survival status differ significantly between the high- and low-risk groups. Univariate (H) and multivariate (I) Cox regression analysis of associations between clinical parameters (including risk score) and overall survival of KIPC patients.