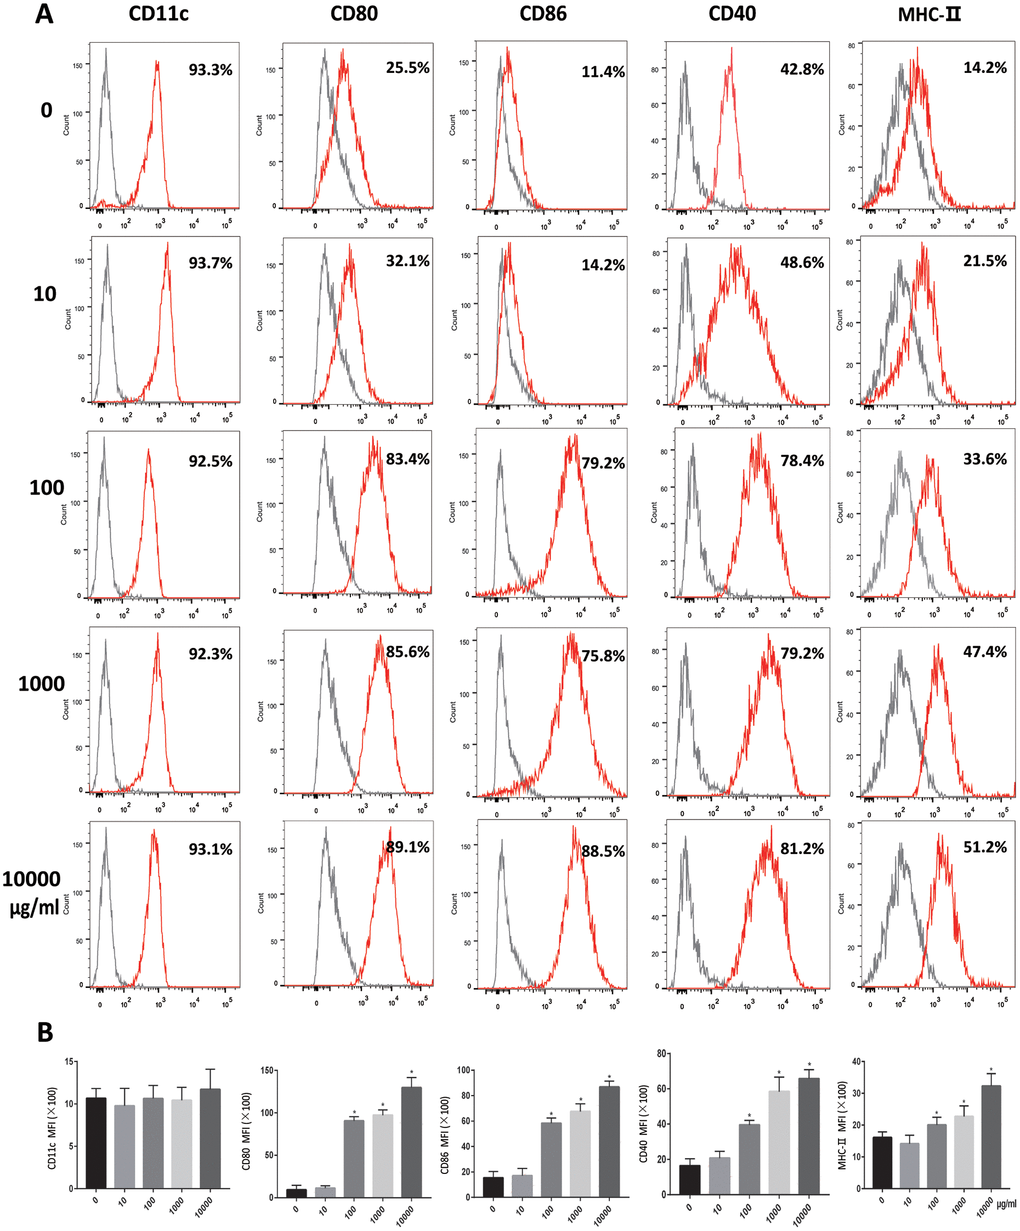
Figure 1.OVA induces DCs maturation. Immature DCs were cultured in the presence of 0, 10, 100, 1000, 10000μg/ml OVA for 24 h. (A). Expression of maturation-related markers on matured DCs (CD11c, CD80, CD86, CD40, MHC-II. Gray shading in histograms represents isotype controls. (B). Summary of the mean fluorescence intensity (MFI) of the indicated surface markers. Data indicate the mean±SD, n = 4. *p<0.05 represents the differences between the treatment group and the control group.