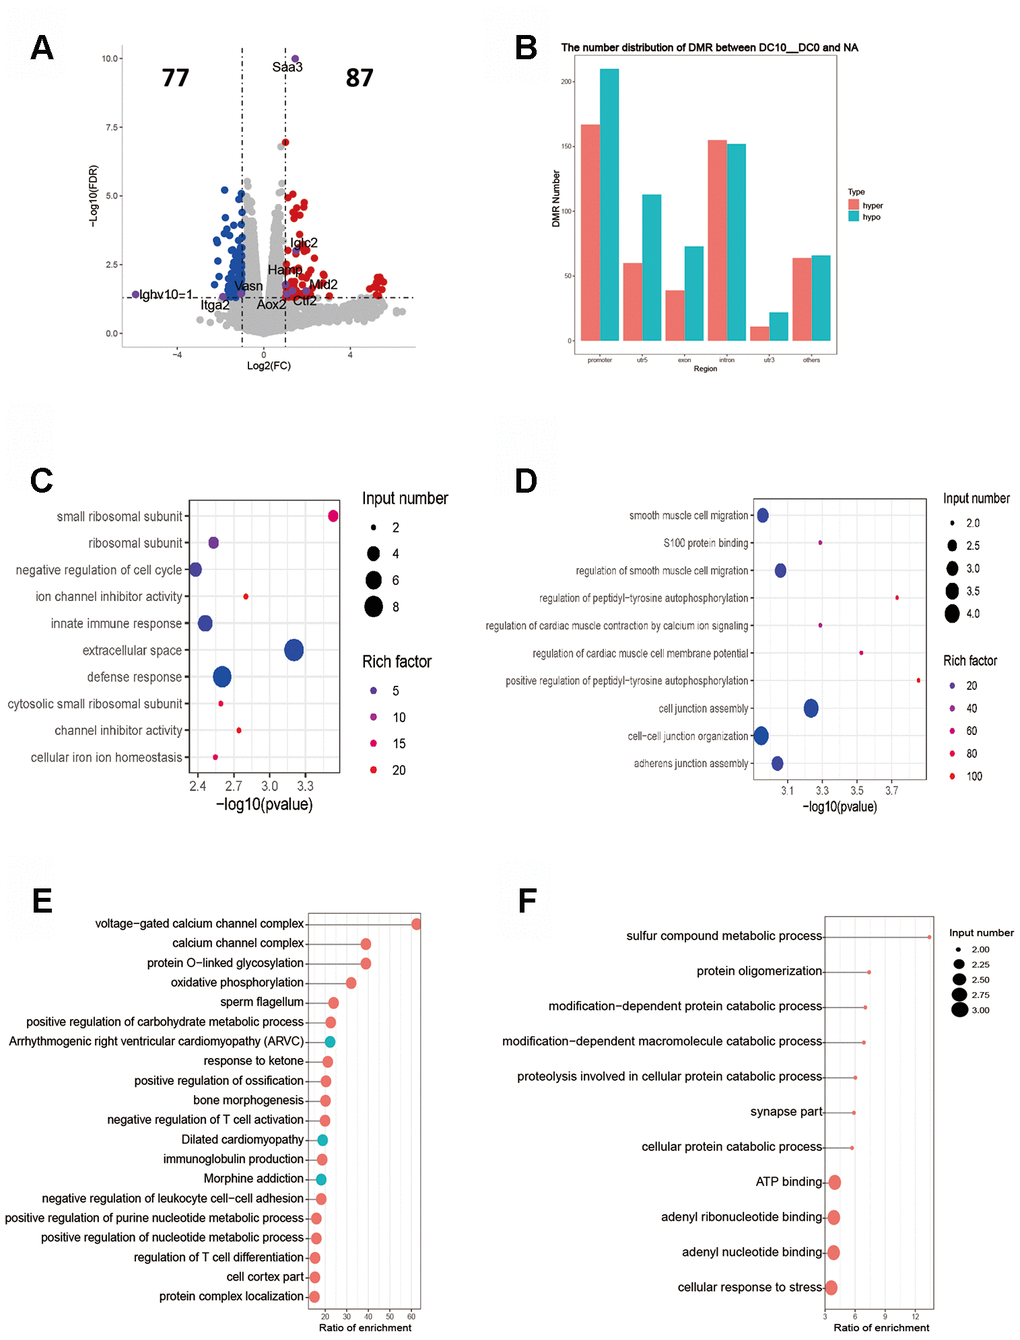
Figure 3.Intergroup analysis of 10-0 DCs. (A) Volcano diagram shows the genes that are differentially expressed; the gray points represent the genes that had no differential expression; the blue points represent the down-regulated genes; the red points represent the up-regulated genes. (B) Distribution of DMR in different regions of the genome. (C) Enrichment analysis of up-expressed genes. (D) Enrichment analysis of down-expressed genes. The horizontal axis indicates the significance of the enrichment (using -log10 (p value). The vertical axis indicates the enrichment. The dot size indicates the number of differentially expressed genes, and the dot gray scale or degree of darkness indicates the degree of rich factor enrichment. Here the 20 top most significant were selected in terms of p values. (E, F). DMR overlap gene pathway enrichment analysis. The results are shown by the scatter diagram. n = 3 independent experiments. (E). Gene body area (F). Promoter area (transcriptional initiation site upstream 2 kb).