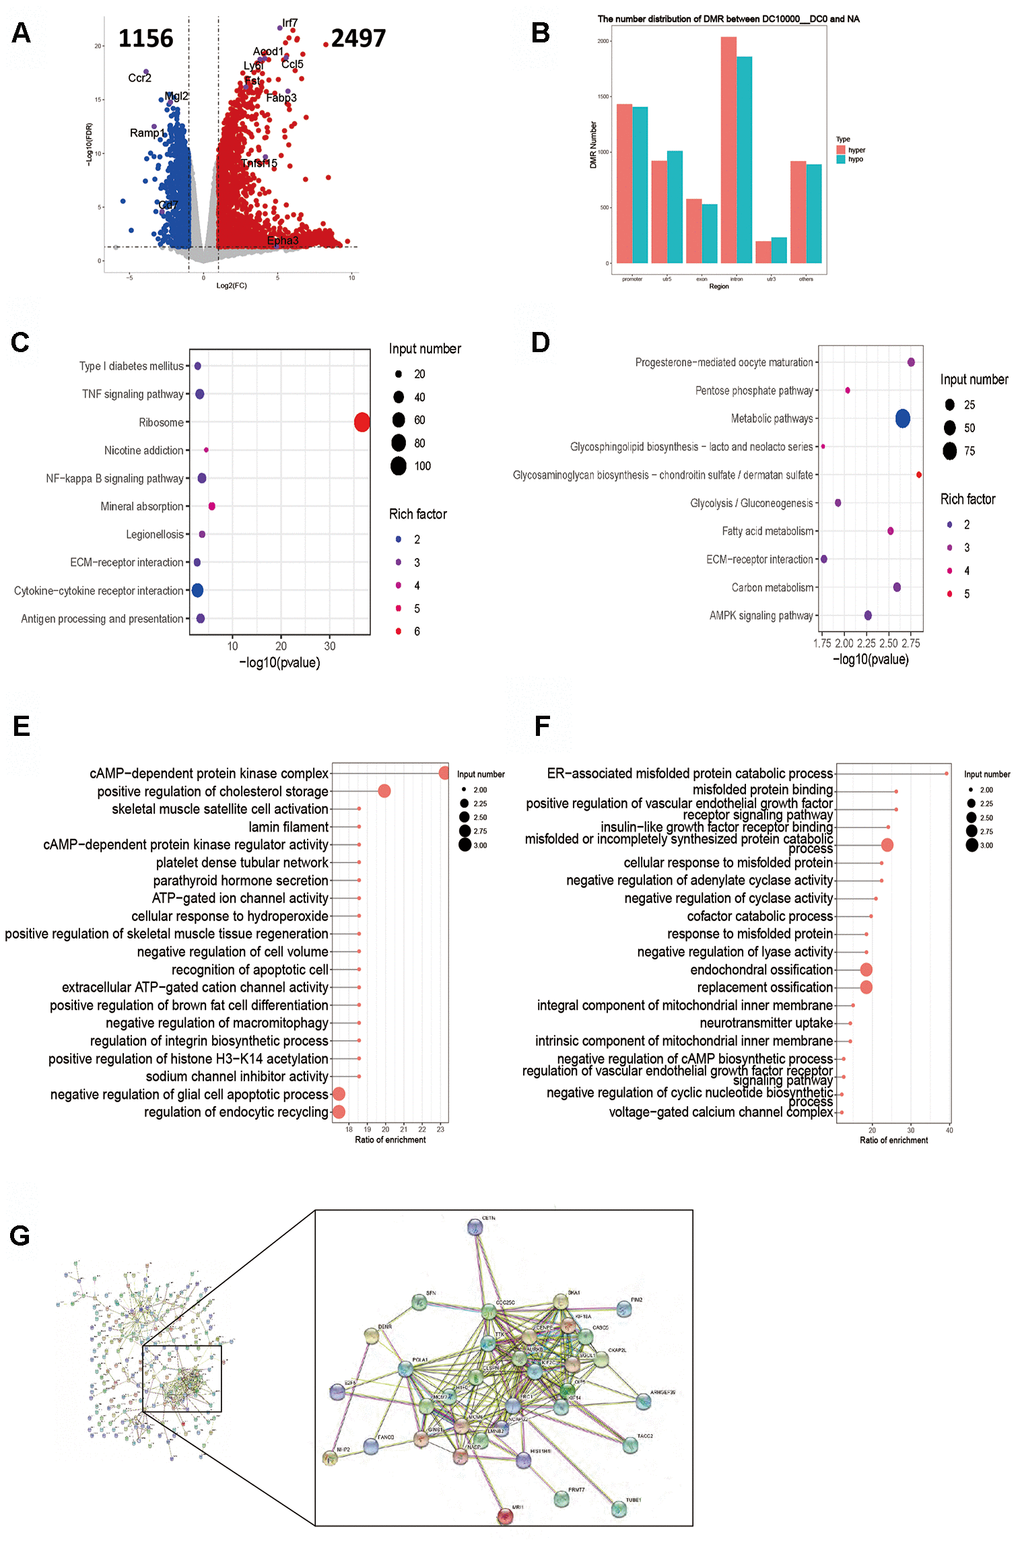
Figure 5.Intergroup analysis of 10000-0 DCs. (A) Volcano diagram shows the genes that are expressed in the difference. (B) Distribution of DMR in different regions of the genome. (C) Enrichment analysis of up-expressed genes. (D) Enrichment analysis of down-expressed genes. (E, F). DMR overlapping gene pathway enrichment analysis, the results are shown by the scatter diagram. (E). Gene body area. (F). Promoter area (transcriptional initiation site upstream 2kb). (G). Screening for genes with significant negative correlation between RNA-seq differential gene expression and average gene methylation level. Significant negative correlation gene-protein Interaction Network Map. n = 3 independent experiments.