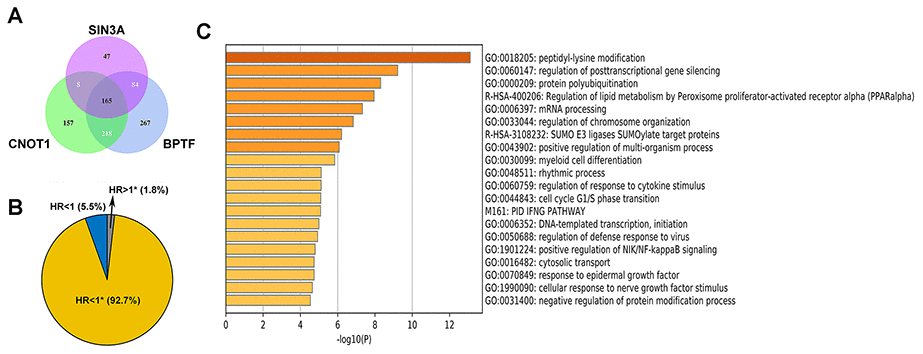
Figure 6.The properties of the intersected genes. (A) Venn diagram shows the number of intersection genes of genes in which correlation with BPTF, CNOT1, and SIN3A was greater than 0.6. (B) Univariate Cox regression results for the overall survival of all 165 intersected genes were displayed by ratio pie plot. "*" means the statistic P-value was significant (P<0.05). (C) Top 20 results of gene ontology analysis upon all 165 intersected genes.