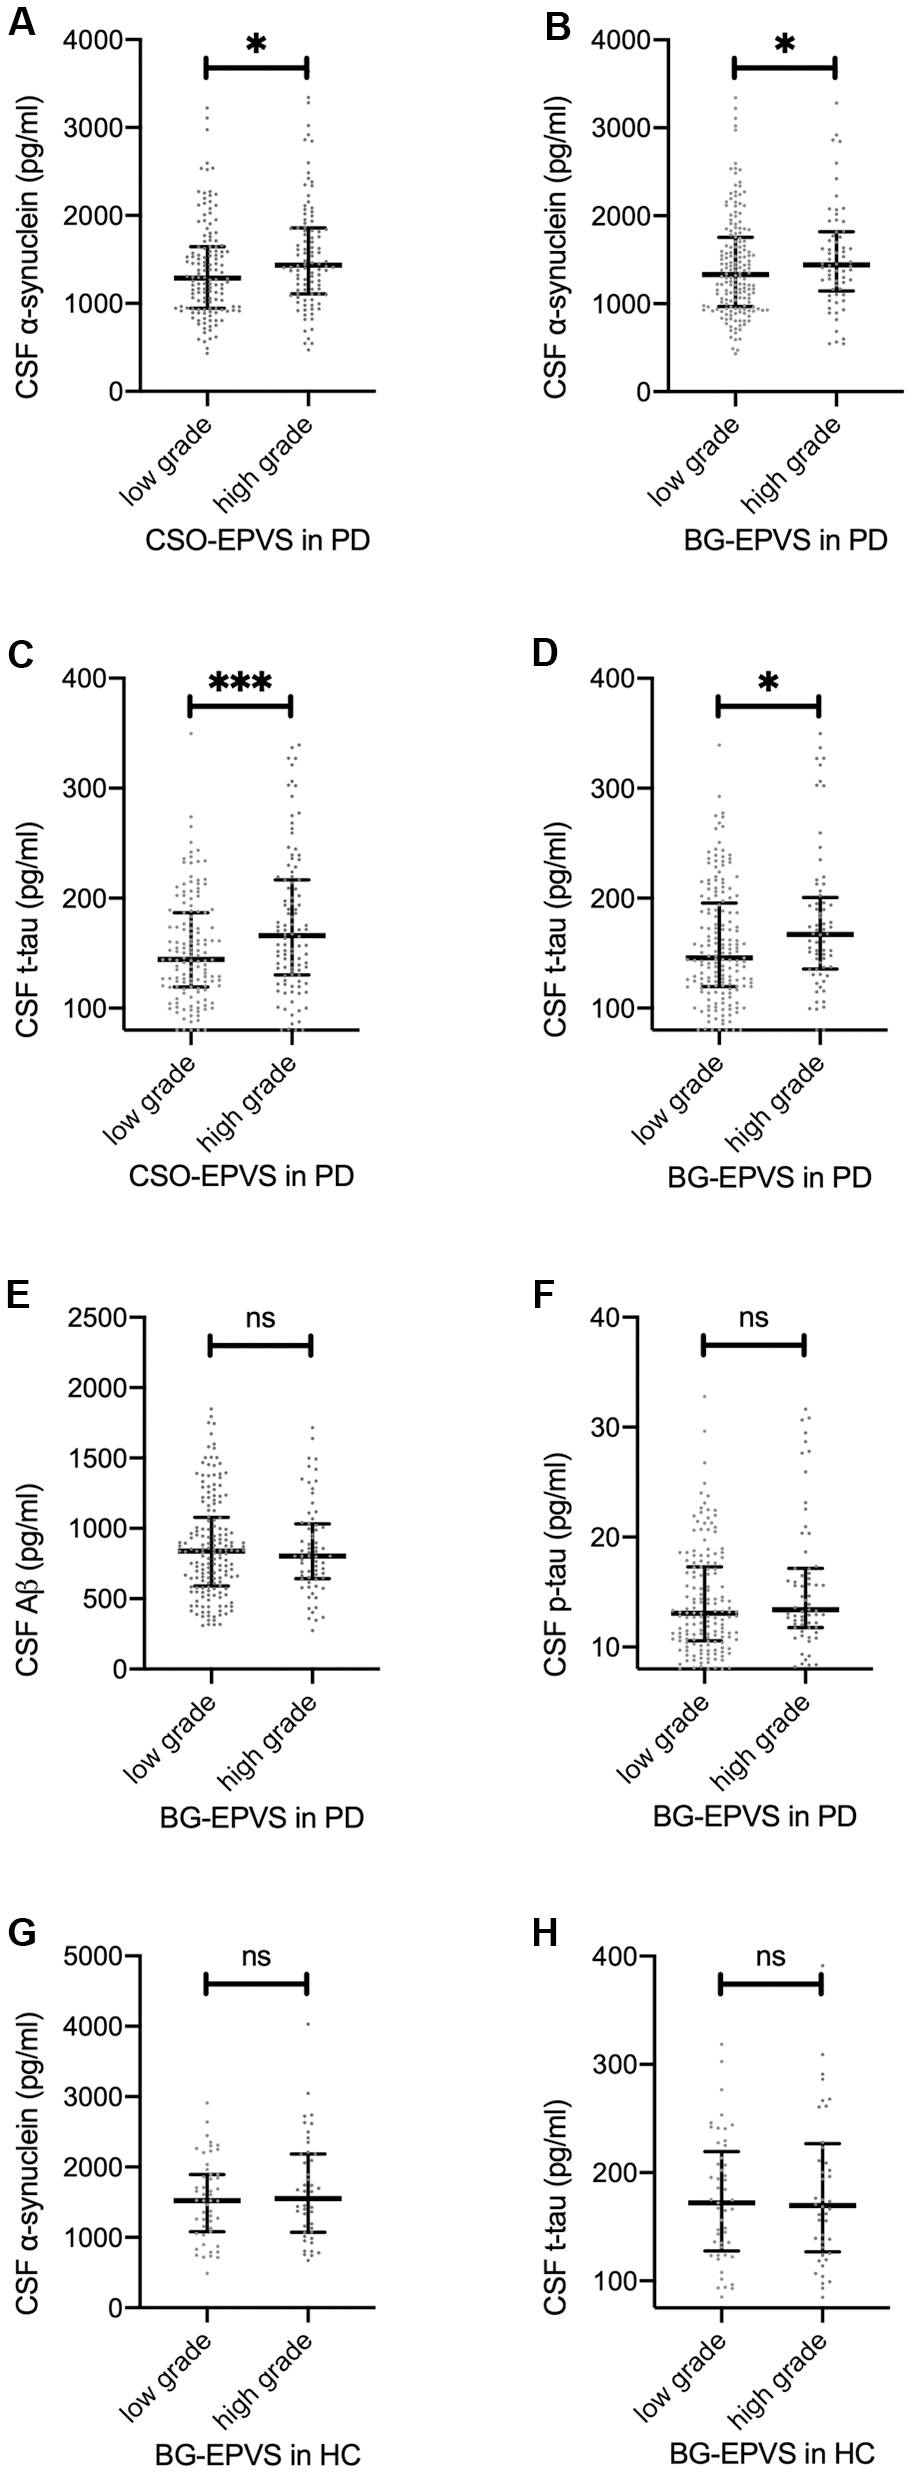
Figure 1.Association between EPVS and CSF proteins. (A–D): baseline CSF α-synuclein (A, B) and t-tau (C, D) values separated by low/high grade CSO EPVS (A, C) and BG EPVS (B, D) in patients with PD. (E, F): baseline CSF Aβ (E) and p-tau (F) values separated by low/high grade BG-EPVS in patients with PD. (G, H): baseline CSF α-synuclein (G) and t-tau (H) values separated by low/high grade BG-EPVS in patients with PD. Lines represent median with interquartile range. Significance on figures represent Spearman correlation of baseline EPVS and CSF proteins. For result of repeated measure linear mixed model, please refer to Table 2.