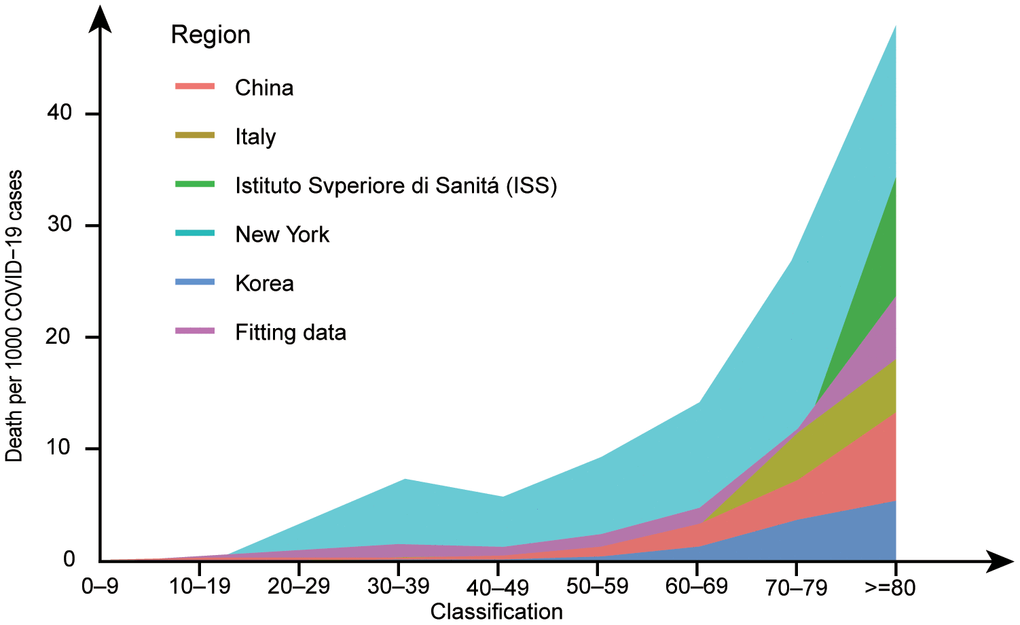
Figure 2.Deaths per 1,000 COVID−19 cases by age group in major epidemic areas. Data from references [6, 101–104] have been amalgamated with the above data to fit the new data. After standardizing the data for each group, the probability of death at each age was fitted and multiplied by 1,000. The ggplot2 package in R version 4.0.0 was used to draw a line graph. Marine green represents New York, red represents China, blue represents South Korea, yellow represents Italy, grass green represents ISS, and purple represents the fitting data. In the line graph, the number of deaths per 1,000 COVID-19 patients increases with age.