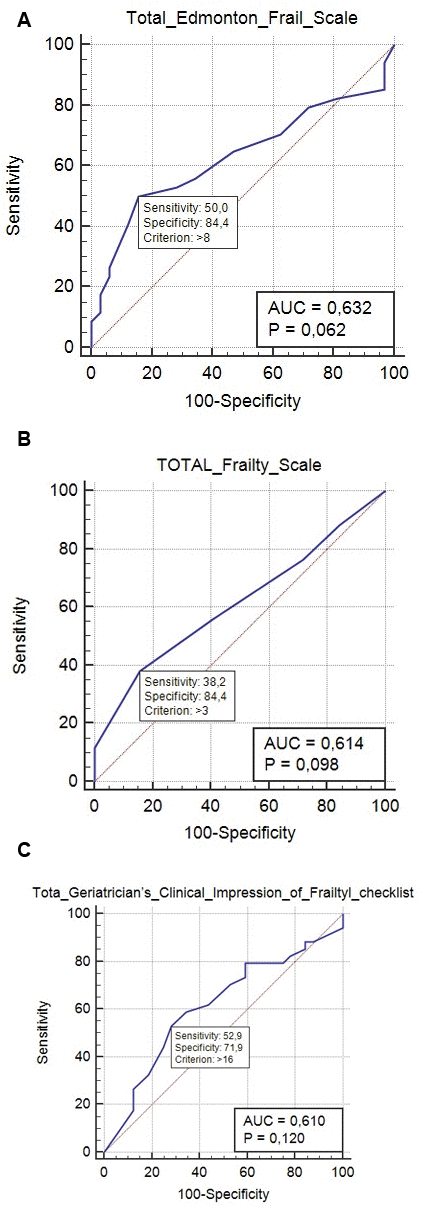
Figure 1.(A) Receiver operating characteristic (ROC) curve for the Edmonton FRAIL Score (EFS) scale for predicting frailty; the optimal prediction point (calculated as the Youden diagnosis index) was 0.632, with a sensitivity of 50% and a specificity of 84%. (B) ROC curve depicting the 5-item FRAIL Score for predicting frailty; the optimal prediction point was 0.614 (Youden index), with a sensitivity of 38.2% and a specificity of 84.4%. (C) ROC curve for the>Geriatricians’ Clinical Impression of Frailty (GCIF) checklist for predicting frailty; the optimal prediction point (Youden index) was 0.610, with a sensitivity of 52.9% and a specificity of 71.9%.