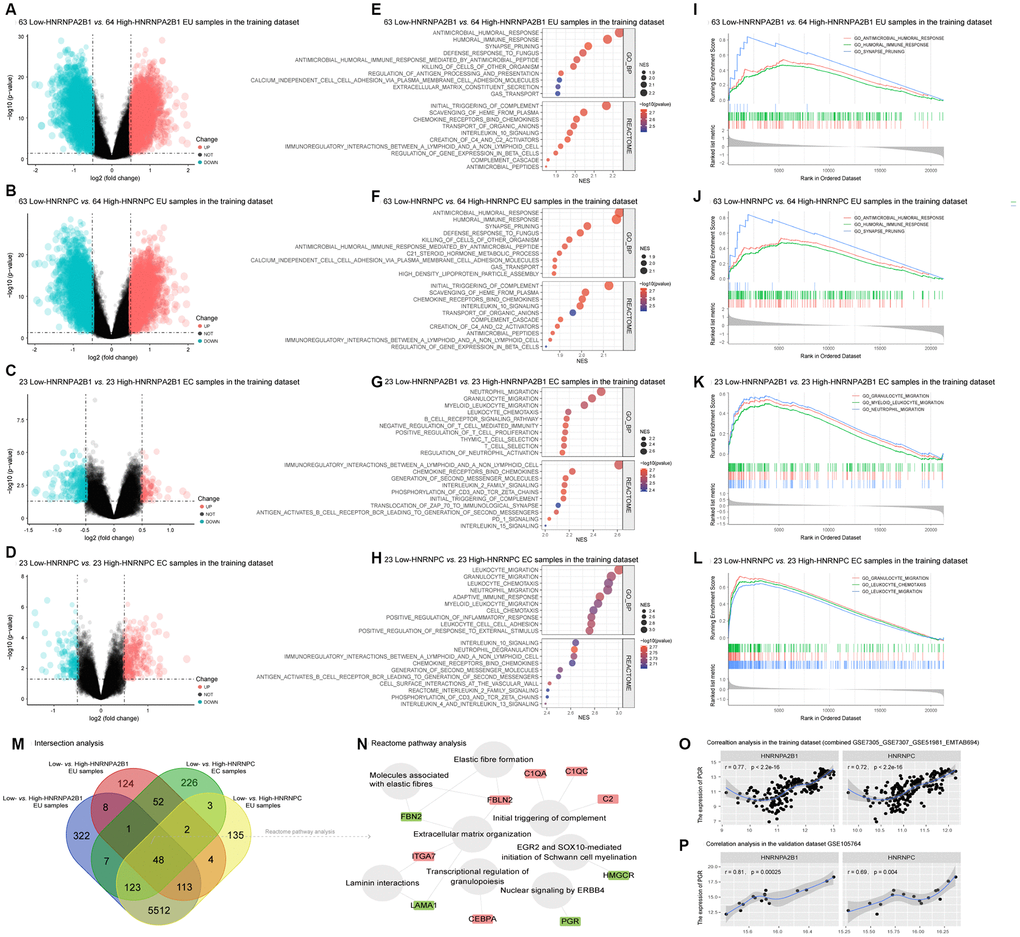
Figure 5.Functional annotation of HNRNPA2B1 and HNRNPC in EMs. (A–D) Differentially expressed genes (DEGs) between low-HNRNPA2B1 vs. high-HNRNPA2B1 EU samples, low-HNRNPC vs. high-HNRNPC EU samples, low-HNRNPA2B1 vs. high-HNRNPA2B1 EC samples, and low-HNRNPC vs. high-HNRNPC EC samples in the training dataset (Green dots, DEGs with log2FC < -0.5 and p < 0.05; Red dots, DEGs with log2FC > 0.5 and p < 0.05; Black dots, |log2FC| < 0.05 or p > 0.05). (E–H) The GSEA analysis of HNRNPA2B1 and HNRNPC in EMs. (I–L) Classical GSEA plots of the top 3 BP terms in each contrast matrix. (M) 48 shared DEGs (|log2FC| > 0.5 and p < 0.05) between low-HNRNPA2B1 vs. high-HNRNPA2B1 and low-HNRNPC vs. high-HNRNPC in EU and EC samples (N) The enriched Reactome pathways of 48 shared DEGs. (Grey circles, Reactome pathways; Red rectangles, up-regulated DEGs; Green rectangles, down-regulated DEGs). (O), (P) The correlation between PGR and HNRNPA2B1, HNRNPC in training and validation datasets. EMs, endometriosis; EU, eutopic endometrium; EC, ectopic endometrium; GSEA, the gene set enrichment analysis; BP, biological process; PGR, progesterone receptor.