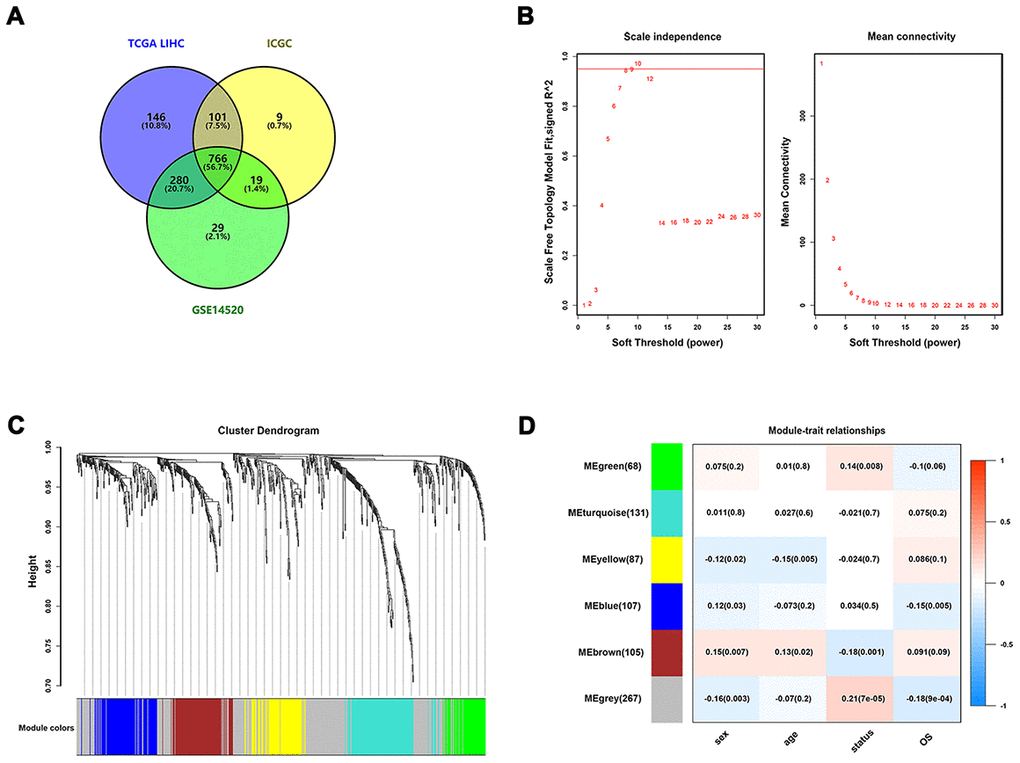
Figure 2.Identification of survival-related IRGs by using WGCNA. (A) Venn diagram was used to visualize overlapping IRGs among TCGA dataset, GEO dataset, and ICGC dataset; (B) The scale-free fit index for soft-thresholding powers. The soft-thresholding power in the WGCNA was determined based on a scale-free R2 (R2 = 0.95). The left panel presents the relationship between the soft-threshold and scale-free R2. The right panel presents the relationship between the soft-threshold and mean connectivity. (C) A dendrogram of the differentially expressed genes clustered based on different metrics. Each branch in the figure represents one gene, and every color below represents one co-expression module. (D) A heatmap showing the correlation between the eigengene and clinical traits. The correlation coefficient in each cell represented the correlation between gene module and the clinical traits, which decreased in size from red to blue.