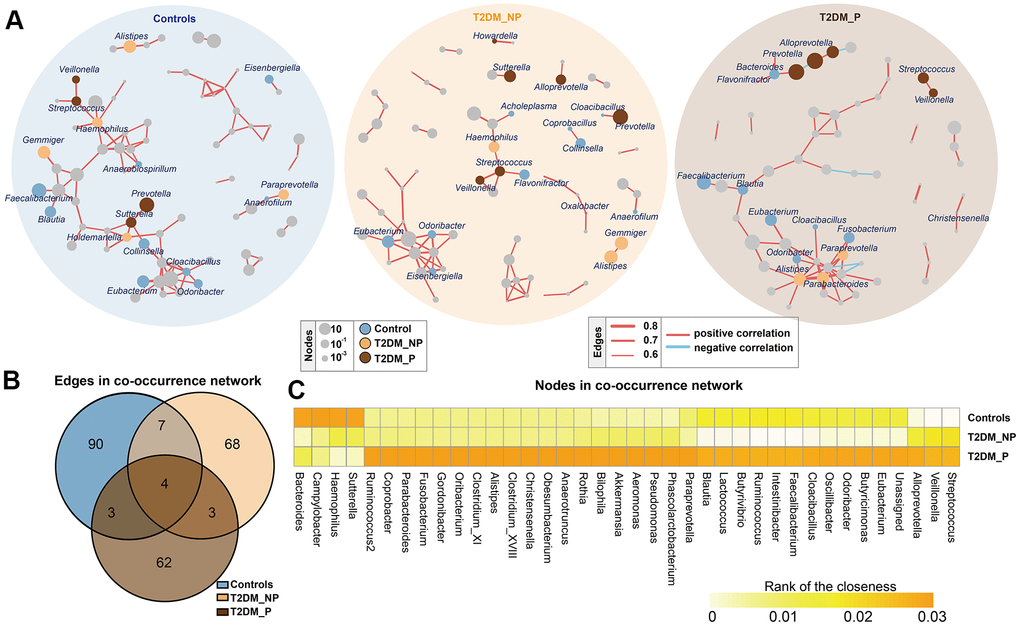
Figure 2.Co-occurrence networks of gut microbiota in different groups. (A) Co-occurrence network analysis of bacterial genera with correlation coefficient >0.6 or <-0.6 in each group. Each network node indicates a bacterial genus. Circle size increases with relative abundance. Circle colors correspond to biomarkers characteristic of the groups in this study; other bacterial genera are shown in gray. Edge widths represents correlation values supporting this connection. Edge colors show positive (red) and negative (blue) correlations, respectively. (B) Numbers of unique and shared edges in three co-occurrence networks. (C) Centralities (rank of closeness) and discrepancies of nodes in different groups.