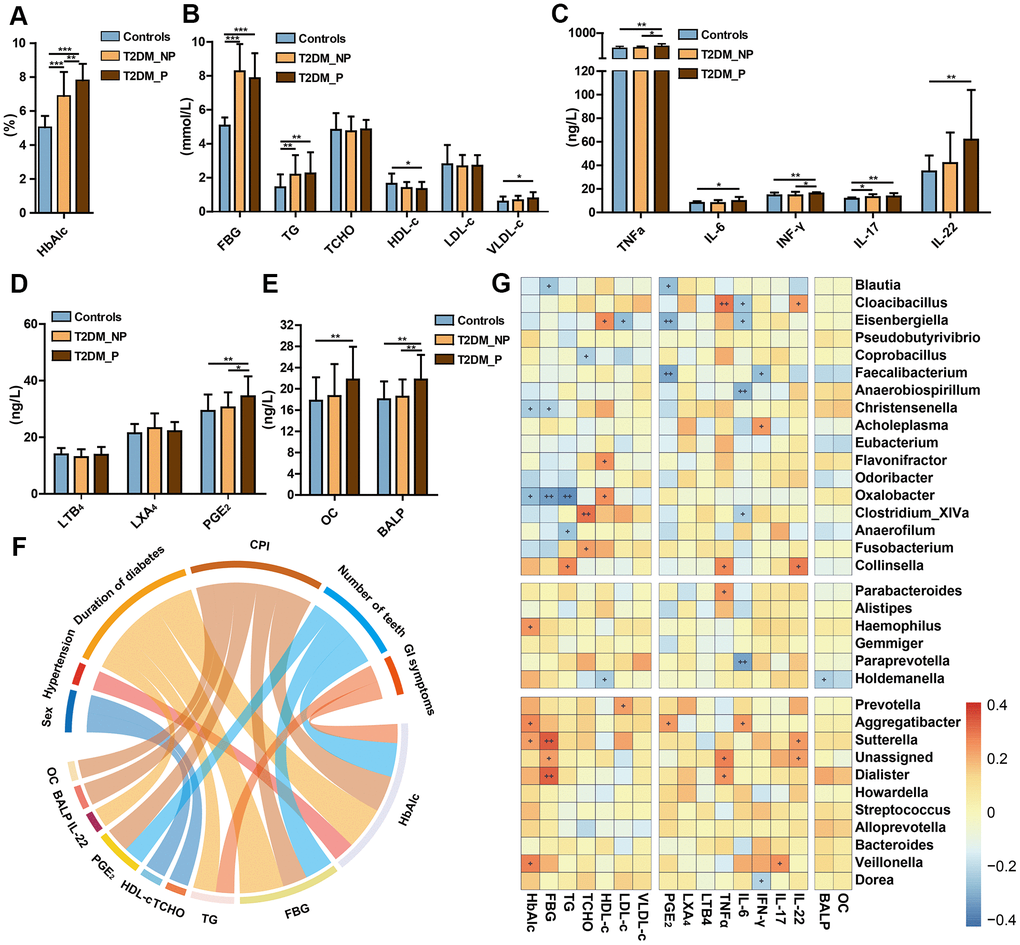
Figure 5.Relationships of periodontal condition, altered gut microbiota, and peripheral risk markers in elderly individuals. Levels of HbA1c (A), FBG and lipids (B), cytokines (C), eicosanoids (D), and bone metabolic markers (E) in T2DM_P, T2DM_NP, and healthy volunteer groups (shown as mean +/- SD). Statistics were calculated by Student's t-test. Significant differences between groups are indicated by *P < 0.05, **P < 0.01, and ***P < 0.001. (F) Circos plot shows significant correlation values for comparisons between plasma risk factors and clinical characteristics in all participants with correlation coefficient > 0.3 or < -0.3. Colors correspond to the direction of correlation; warm shades denote positive relationships and cool tones denote negative correlations. (G) Heatmap depicts correlations between gut microbial biomarkers and peripheral risk markers. Non-parametric Spearman correlation coefficients were calculated between each of 34 gut microbial biomarkers and peripheral risk markers. Colors range from blue (negative correlation) to red (positive correlation). Significant relationships are indicated by +P < 0.05, ++P < 0.01, and +++P < 0.001.