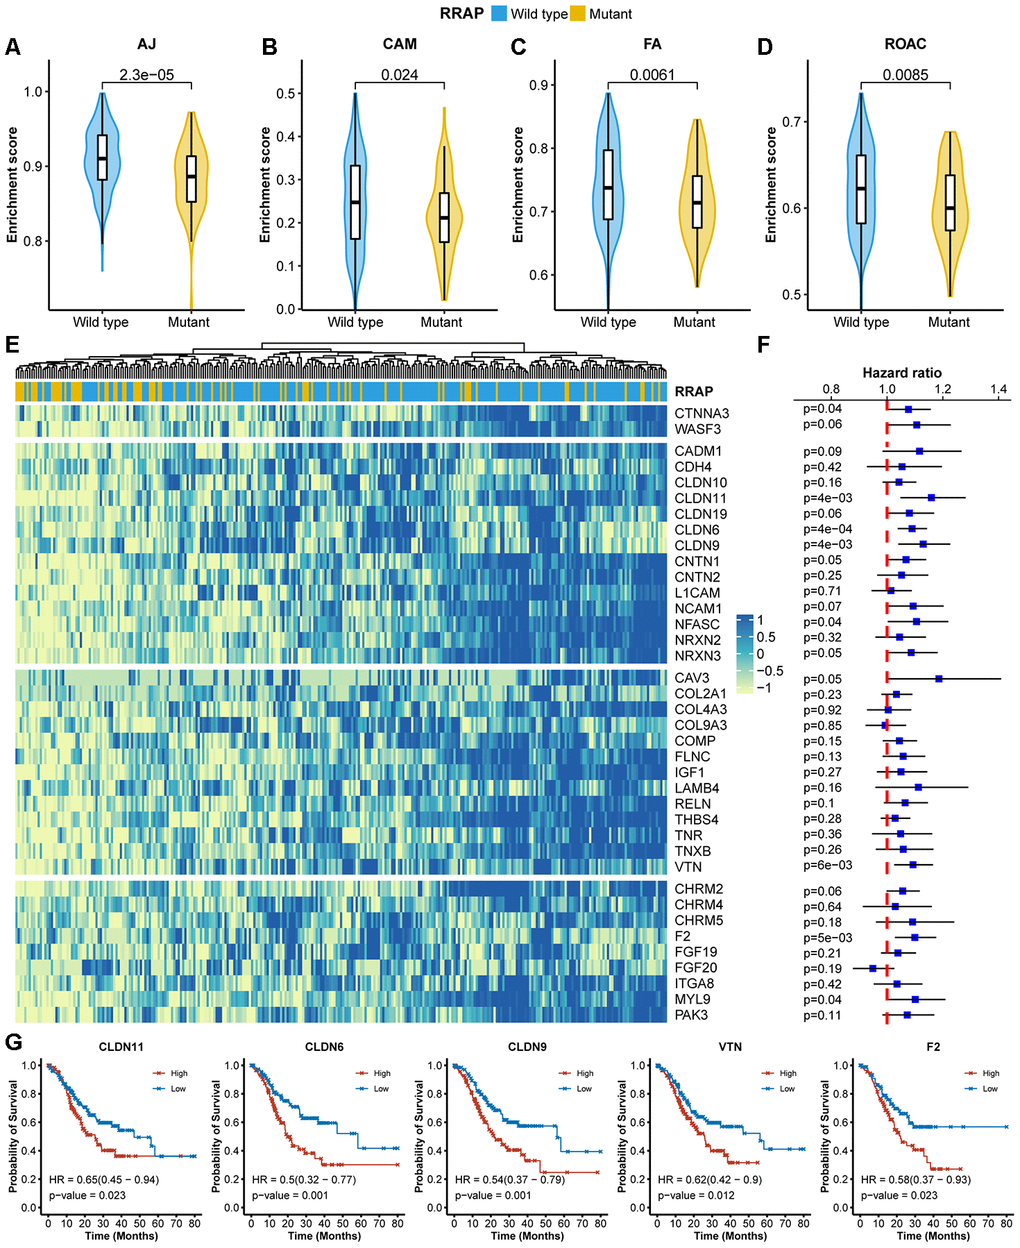
Figure 3.Association of RRAP with lower cell migration activity. (A–D) Pathway enrichment scores between RRAP-wild type and RRAP-mutant were compared among 4 functions: adherens junction (AJ, A), cell adhesion molecules (CAM, B), focal adhesion (FA, C), and regulation of the actin cytoskeleton (ROAC, D). The Wilcoxon rank-sum test was applied to estimate differences. (E) Heatmap of differentially expressed genes among the 4 functions; the column was clustered and annotated with RRAP status. (F) Forest plot of association of between gene expression and overall survival. Squares indicate the hazard ratios and error bars represent the 95% confidence interval; the log-rank test was performed to estimate p-values. (G) Kaplan-Meier overall survival curves for patients with high and low expression levels of CLDN11, CLDN6, CLDN9, VTN, and F2. P-values were estimated with the log-rank test, and HRs were estimated with the Cox model.