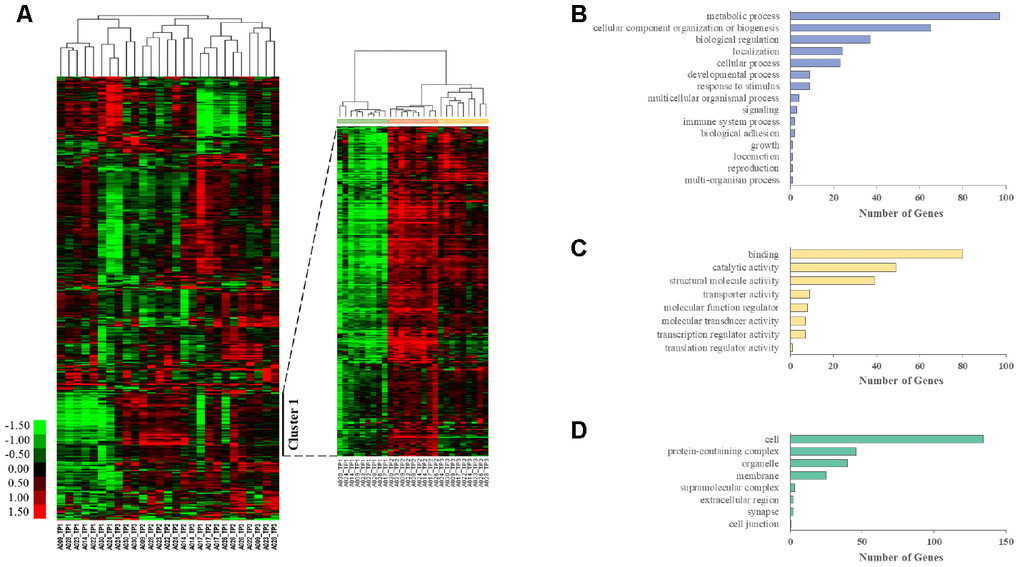
Figure 1.Longitudinal aging-associated global expression profiling. (A) Hierarchical clustering is presented in a matrix format, where each row represents an individual gene and each column represents a different time point in each AGM. Red, high expression; green, low expression. Cluster 1 contains the genes that are highly expressed in TP2 and TP3 compared with those in TP1. PANTHER GO slim enrichment analysis of (B) biological processes (BP), (C) molecular function (MF), and (D) cellular components (CC).