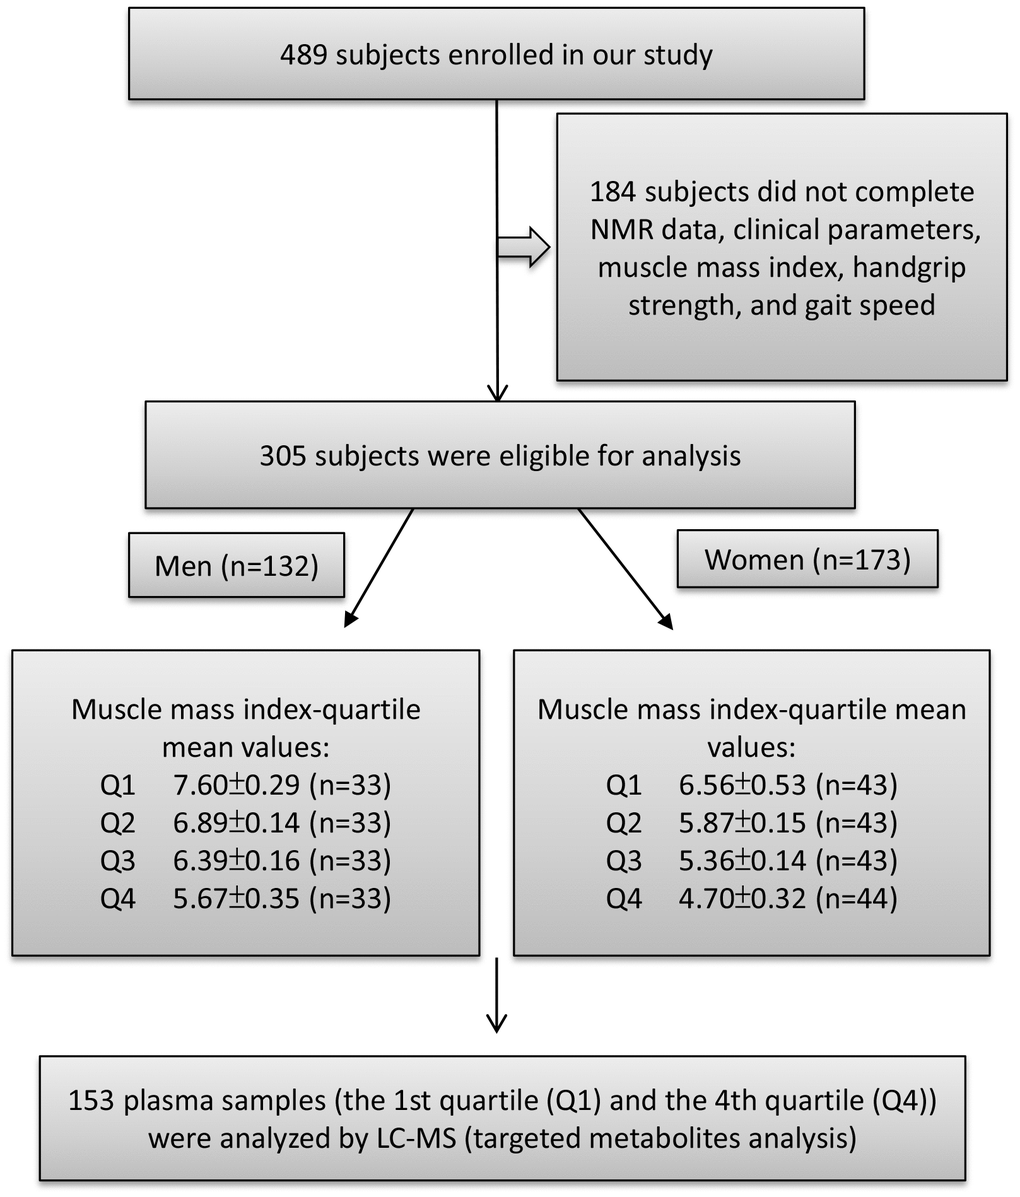
Figure 1.Study flow diagram shows number of participants for untargeted and targeted metabolite analysis. A total of 489 participants enrolled in this study of which 305 subjects were eligible to participate. According to appendicular skeletal muscle mass index (ASMI) values, we divided the male and female subjects into four groups each by quartile. The ASMI values of quartile 1, 2, 3, and 4 (Q1, Q2, Q3, and Q4) were 7.60±0.29, 6.89±0.14, 6.39±0.16, and 5.67±0.35 kg/m2, respectively. In the female group, quartile 1, 2, 3, and 4 (Q1, Q2, Q3, and Q4) ASMI values were: 6.56±0.53, 5.87±0.15, 5.36±0.14, and 4.70±0.32 kg/m2, respectively. The first quartile (Q1) was defined as the control group and the fourth quartile (Q4) as the muscle loss group. Both Q1 and Q4 were performed for metabolite analysis.