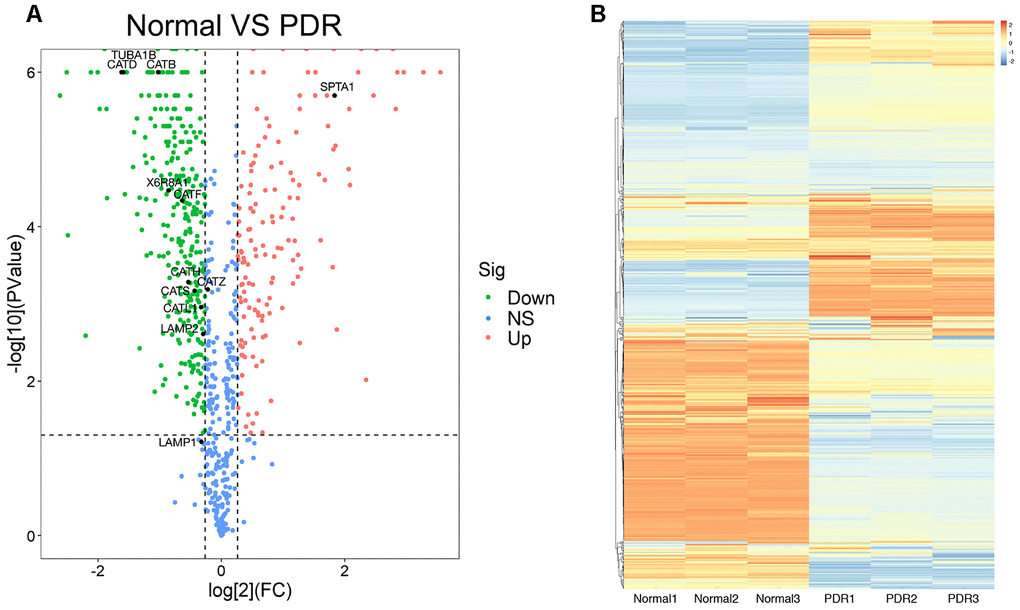
Figure 1.The proteomics analysis of vitreous samples of the patients with RRD and PDR. (A) A volcano map showed the differentially expressed proteins in vitreous samples of RRD and PDR groups (n = 3/group). The blue dots indicate the proteins whose expression was not significantly different between the two groups; the red dots indicate the significantly upregulated proteins in PDR group as compared to RRD group; the green dots refer to the significantly downregulated proteins. The significantly downregulated CTSB, CTSD, and CTSL proteins were designated. (B) Clustering analysis of protein expression in the experimental groups. The color scale on the right illustrated the relative expression levels of proteins in RRD and PDR groups. Red denoted the relative expression level greater than 0 and blue less than 0. RRD: rhegmatogenous retinal detachment; PDR: proliferative diabetic retinopathy; FC: fold change; Sig: significance; Down: downregulation; NS: not significant; Up: upregulation.