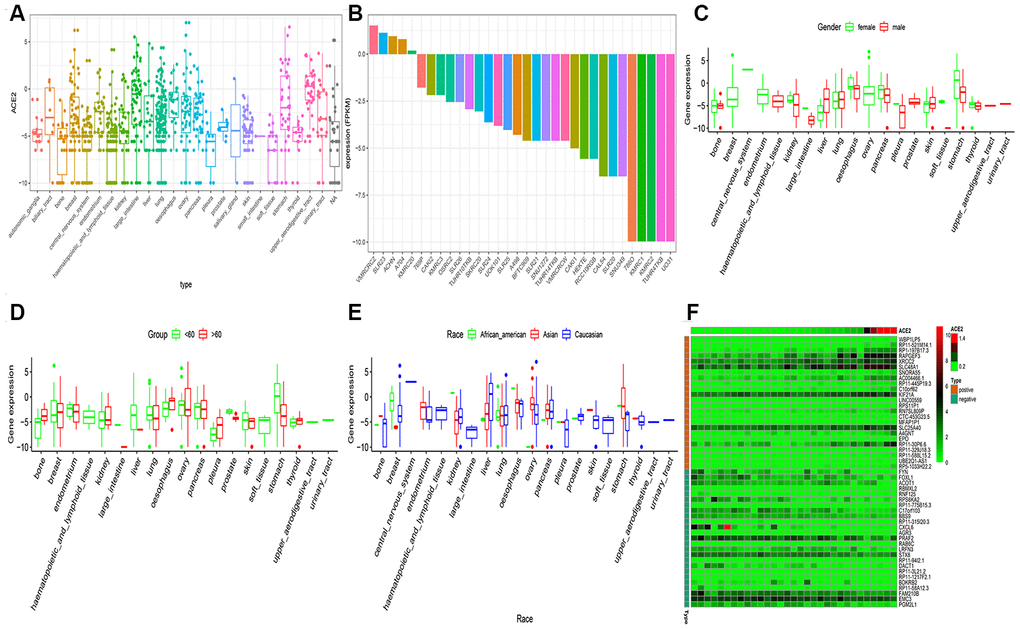
Figure 3.RNA-seq analysis of public CCLE datasets. (A) The Box plot exhibits of ACE2 expression in childhood tumor; (B) The Box plot exhibits of ACE2 expression in kidney cancer cell line; The disparities of gender (C), age (D) and race (E) was shown in the CCLE dataset. (F) The heatmap exhibits the top 25 positively/negatively related to ACE2 expression. Statistical significance was detected using Wilcox test for comparisons between two groups and Kruskal–Wallis test for more than two groups.