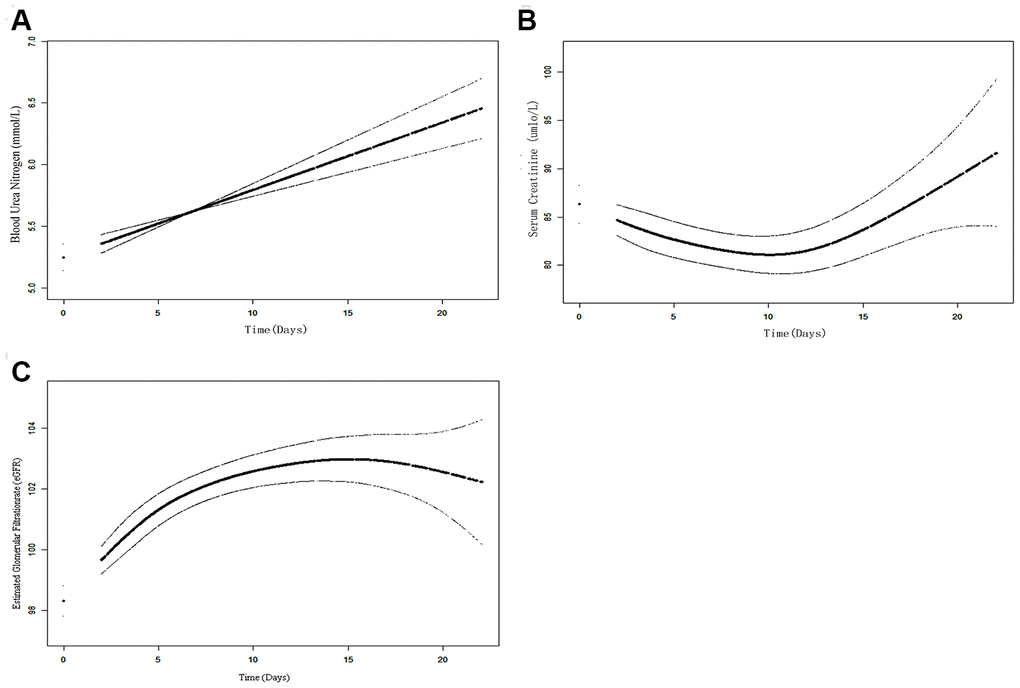
Figure 7.The time-variation trend of kidney functions overtime during hospitalization using the GAMM model. (A) The increased time-vary linear trend of BUN can be observed; (B) The increased time-vary non-linear trend of Cr; (C) The increased time-vary non-linear trend of eGRF.