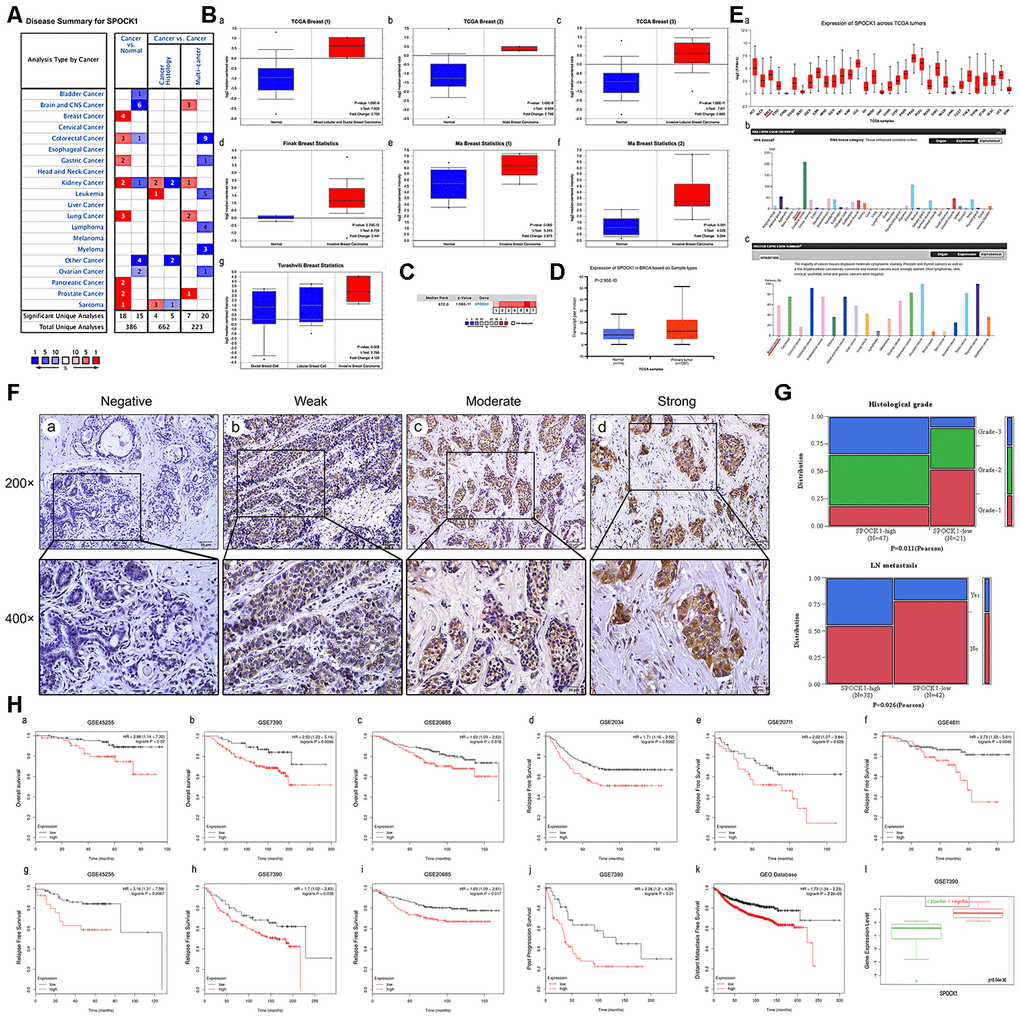
Figure 1.Overexpression of SPOCK1 is positively associated with histological grade, LN metastasis and poor prognosis in BC. (A) The graphic showed the numbers of datasets with statistically significant mRNA high expression (red) or down-expression (blue) of SPOCK1 (cancer vs. Normal tissue). The P-value threshold was 0.01. (B) Box plots derived from gene expression data in Oncomine comparing expression of SPOCK1 in normal and BC tissue. The P-value was set up at 0.01 and fold change was defined as 2. (C) A meta-analysis of SPOCK1 gene expression from seven Oncomine databases where colored squares indicated the median rank for SPOCK1 (vs. Normal tissue) across 7 analyses. (D) The expression of SPOCK1 was elevated in BC compared to normal breast tissues. Data derived from UALCAN database. (E) Expression of SPOCK1 across TCGA carcinomas from Ualcan database (a); overview of SPOCK1 protein levels in BC tissues and normal breast tissues (b-c). (F) IHC staining (negative, weak, moderate and strong expression) for SPOCK1 in BC tissues (a-d). (G) Relationships between SPOCK1 expression and clinicopathologically significant aspects of BC. (H) Overall survival (OS) (a-c), relapse free survival (RFS) (d-i), post progression survival (PPS) (J), distant metastasis free survival (DMFS) (k) and risk assessment curves (l) of patients with or without elevated SPOCK1 levels. Survival data derived from Kaplan–Meier (KM) plotter database. High SPOCK1 expression levels were found in high risk groups of BC patients. Box plots generated by SurvExpress showed the expression levels of SPOCK1 in indicated dataset and the P-value resulting from a t-test. Low-risk groups are denoted in green and high-risk groups in red, respectively.