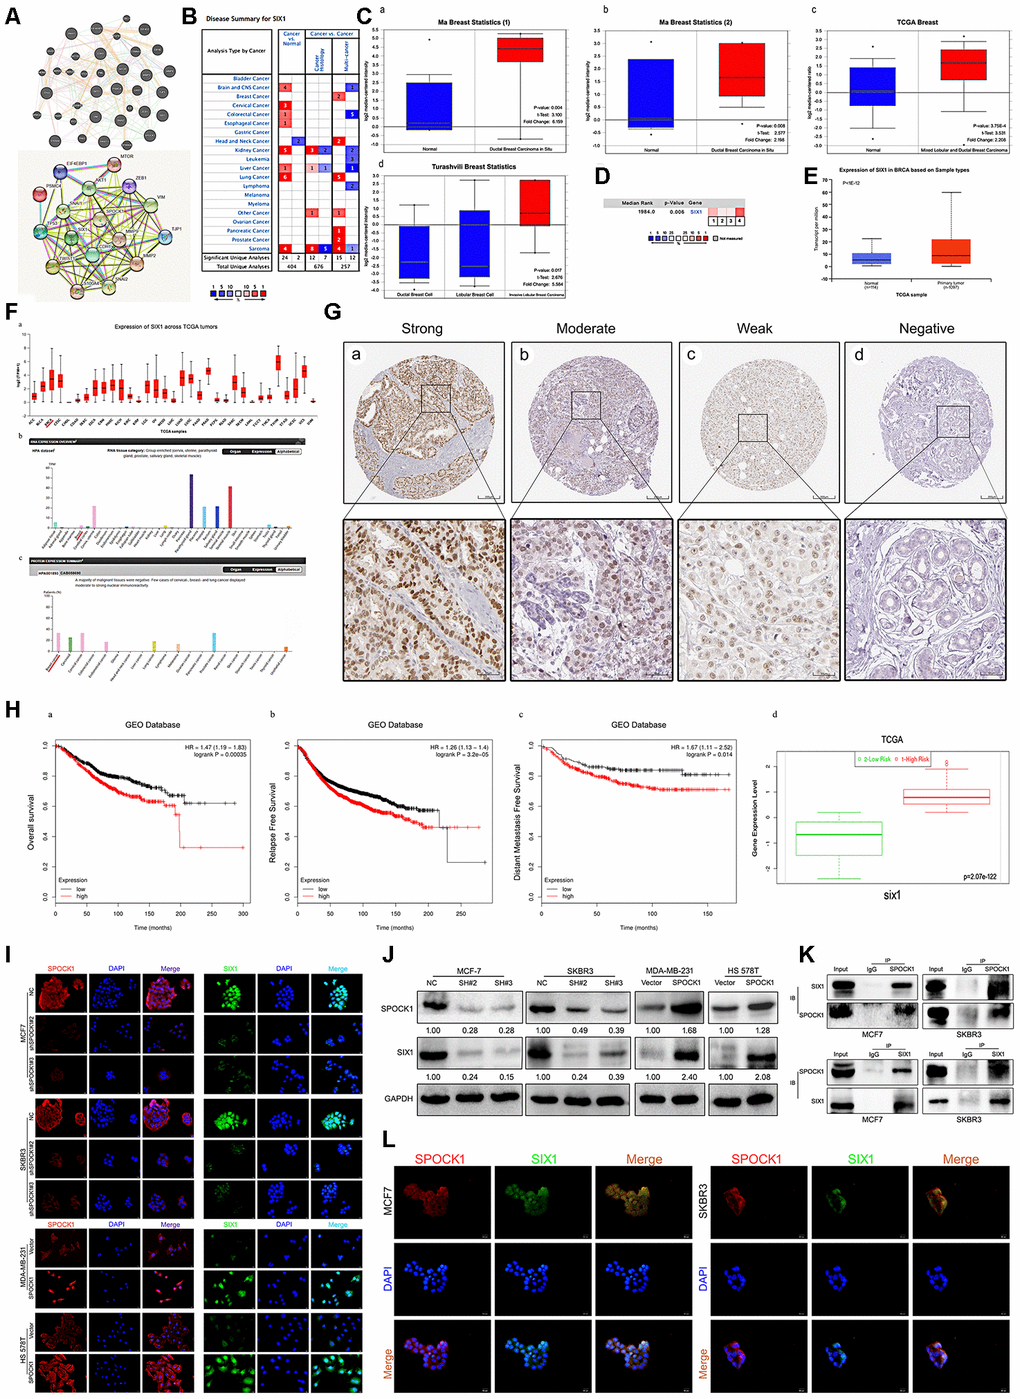
Figure 5.Identification of SIX1 as a downstream mediator of SPOCK1 in BC cells. (A) Network diagram of SPOCK1/SIX1 protein interaction by GeneMANIA (a) and STRING (b). (B) The graphic showed the numbers of datasets with statistically significant mRNA high expression (red) or down-expression (blue) of SIX1 (cancer vs. Normal tissue). The P-value threshold was 0.01. (C) Box plots derived from gene expression data in Oncomine comparing expression of SIX1 in normal and BC tissue. The p value was set up at 0.01 and fold change was defined as 2. (D) A meta-analysis of SIX1 gene expression from four Oncomine databases where colored squares indicated the median rank for SIX1 (vs. Normal tissue) across 4 analyses. (E) The expression of SIX1 was elevated in BC compared to normal breast tissues. Data derived from UALCAN database. (F) Expression of SIX1 across TCGA carcinomas from Ualcan database (a); overview of SIX1 protein levels in BC tissues and normal breast tissues (b-c). (G) IHC staining (negative, weak, moderate and strong expression) for SIX1 in BC tissues (a-d). Data derived from HPA database. (H) Overall survival (OS) (a), relapse free survival (RFS) (b) and distant metastasis free survival (DMFS) (c) curves of patients with or without elevated SIX1 levels. Data derived from Kaplan–Meier (KM) plotter database. High SIX1 expression levels were found in high risk groups of BC patients (d). Data derived from SurvExpress database. (I, J) Expression levels of indicating cells were assayed by IF and western blotting. GAPDH was used as an internal control. (K) The interaction between endogenous SPOCK1 and SIX1 proteins was analyzed by coimmunoprecipitation in MCF7 and SKBR3 cells. (L) Immunofluorescence double-labeling experiments confirmed the existence of SPOCK1-SIX1 colocalization phenomena in the cytoplasm. The scale bar is 20 μM.