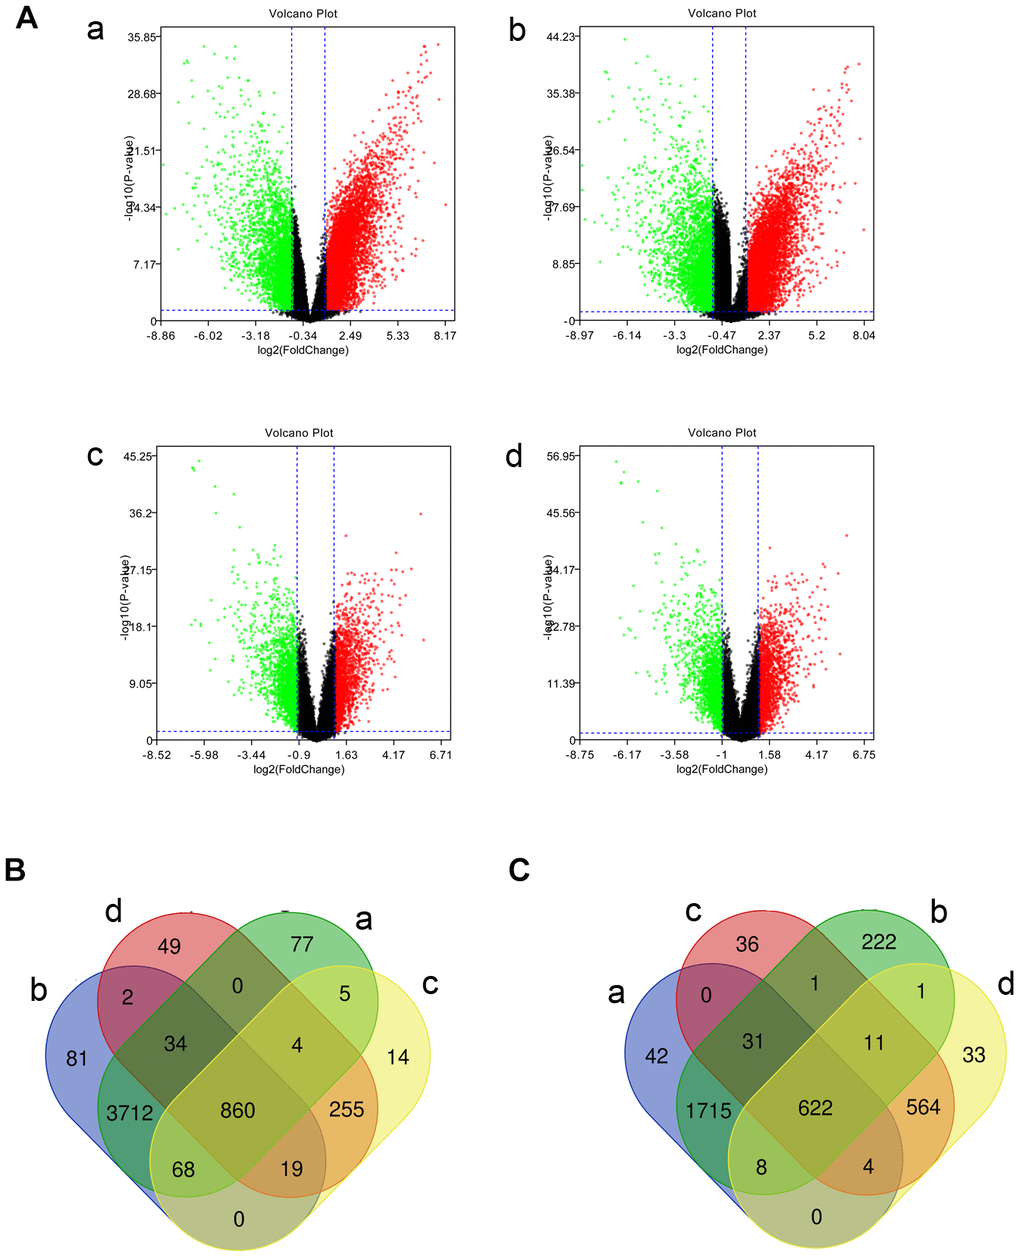
Figure 1.Identified differentially expressed mRNAs (DE-mRNAs) among triple-negative breast cancer (TNBC) tissues, tissues of other types of breast cancer, and normal samples in two Gene Expression Omnibus data sets. (A) The volcano plots of DE-mRNAs in the GSE45827 and GSE65194 data sets. The x-axis stands for log2 (fold change) of gene expression, and y-axis represents log-transformed P value. The red dots and green dots indicate the significantly overexpressed and underexpressed genes, respectively. The black dots indicate genes with no significant differential expression. |log2FC| > 1 and P value < 0.05 were the cutoff criteria. (B) The intersection of upregulated DE-mRNAs. (C) The intersection of downregulated DE-mRNAs. a: TNBC compared with normal samples in GSE45827; b: TNBC compared with normal samples in GSE65194; c: TNBC compared with tissues of other subtypes of breast cancer in GSE45827; d: TNBC compared with tissues of other subtypes of breast cancer in GSE65194.