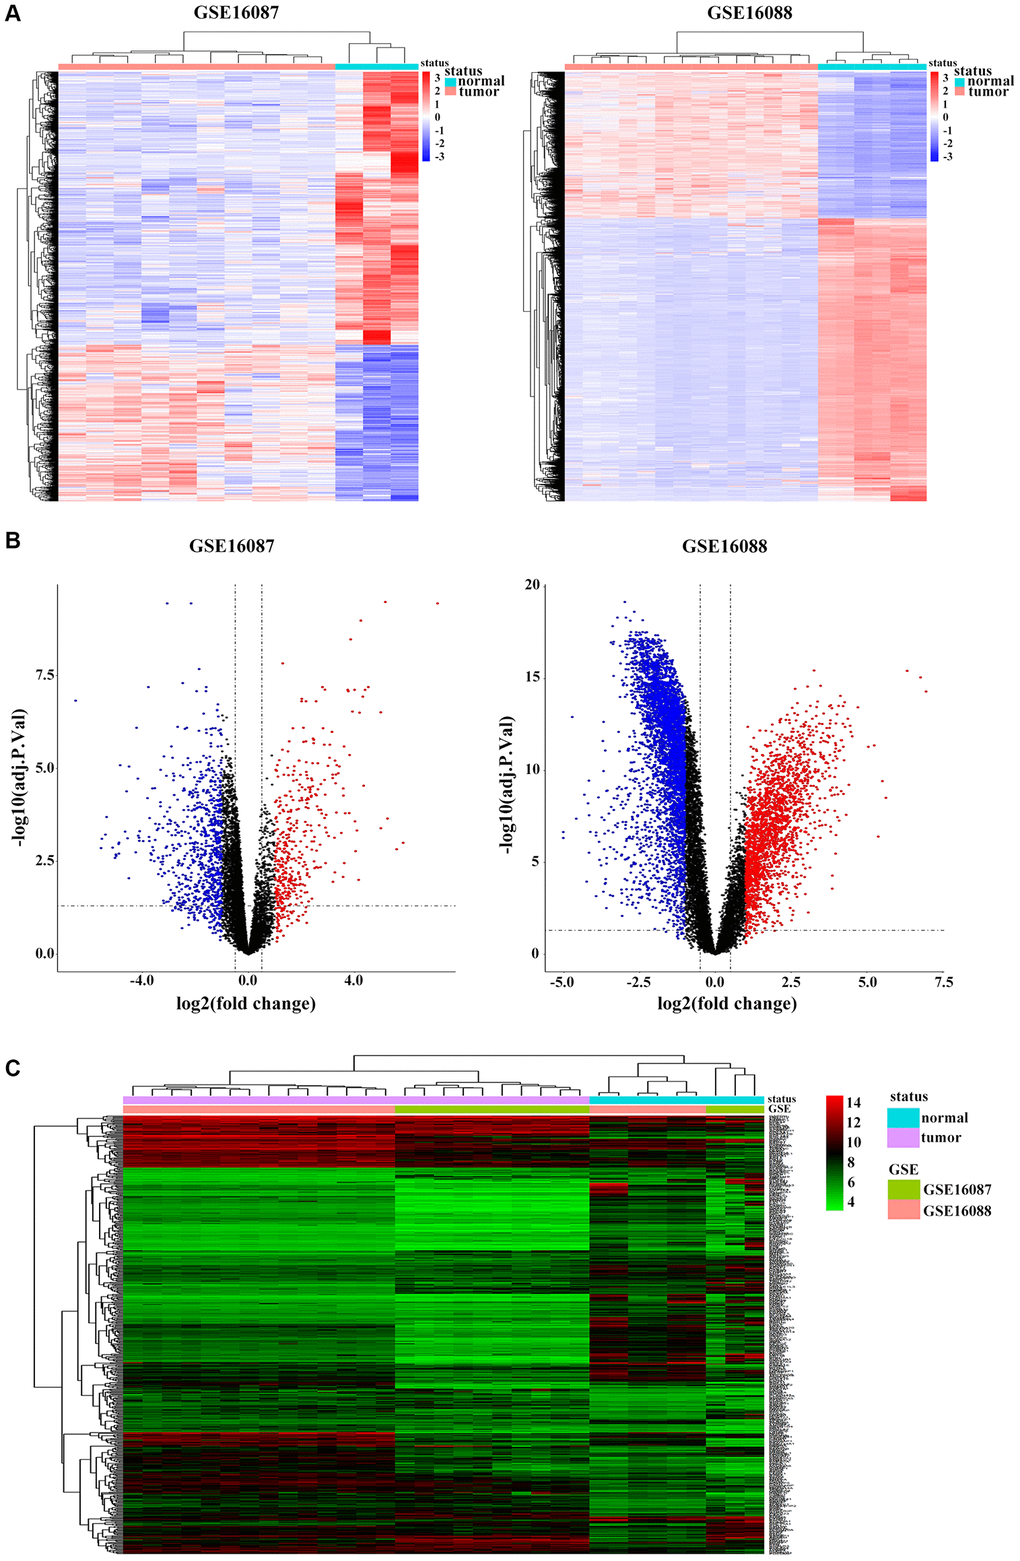
Figure 1.Identification of DEGs in OS. (A) Heatmap shows differential expression profiles in normal tissues and tumor tissues from the GSE16087 and GSE16088 datasets. DEGs were defined with |log2FC| > 1 and adjusted P-value < 0.05. (B) Genome-wide gene expression profiles of OS tumor and normal tissues from two GSE datasets were shown with volcano plots. Black symbols represent normally expressed genes. Red and blue symbols represent the aberrantly expressed genes with |log2FC| > 1 and adjusted P-value < 0.05. (C) Hierarchical clustering analysis of differential expression profiles of 515 common DEGs in OS tumor and normal tissues from the two GSE datasets. Blue and red blockages respectively indicate the expression level of genes lower or higher than the median expression value across all samples.