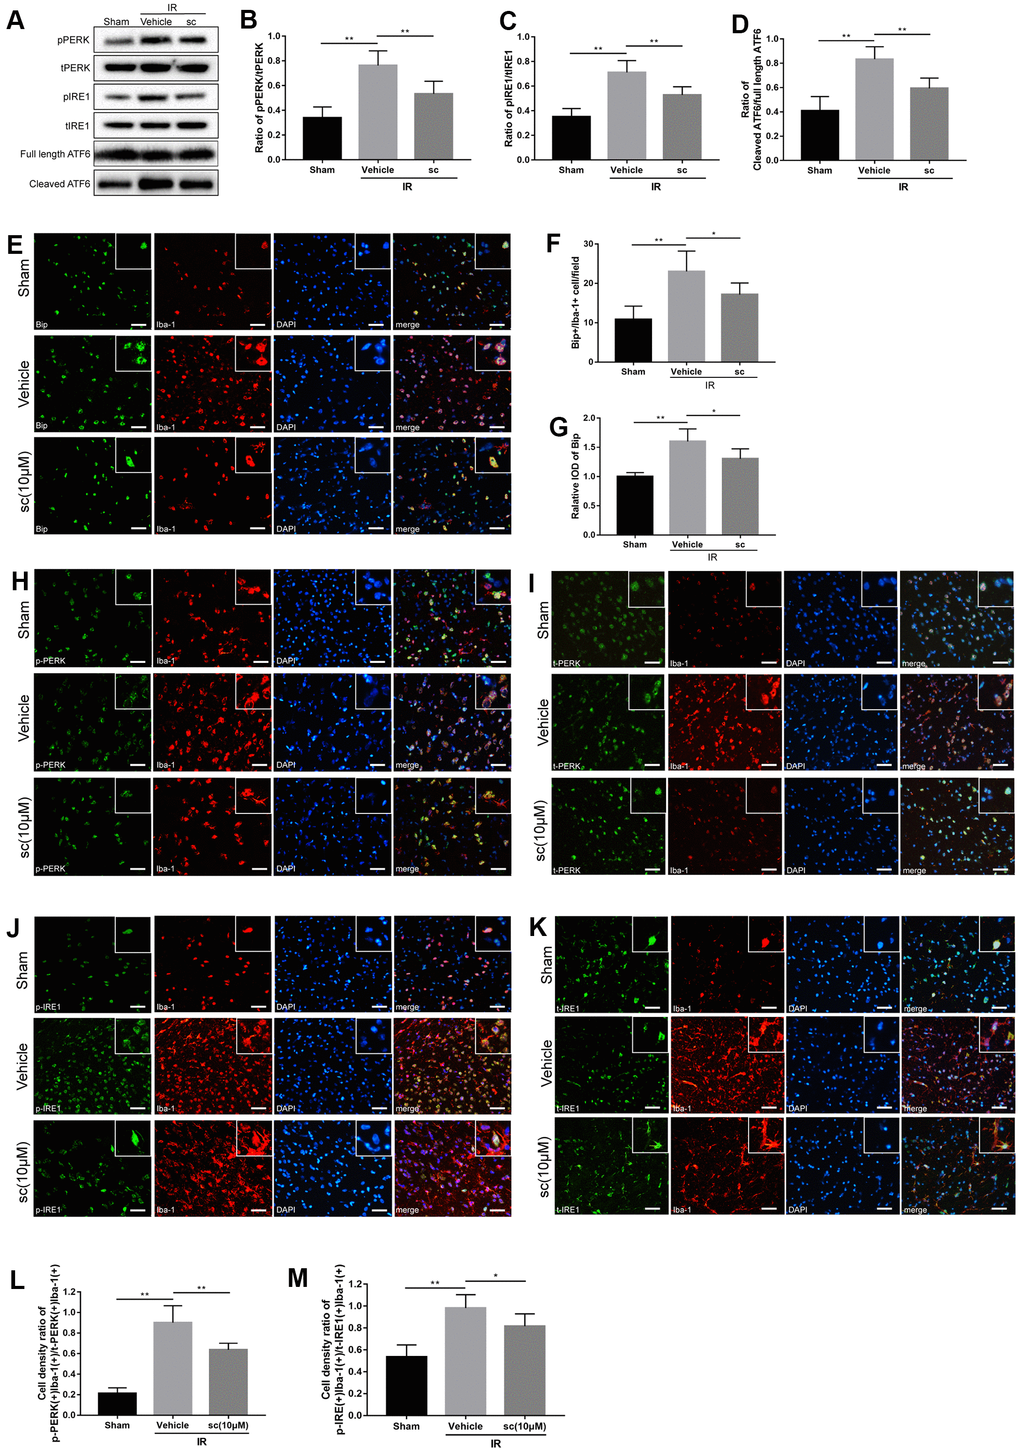
Figure 3.Microglial endoplasmic reticulum (ER) stress was mitigated by PTP1B inhibitor treatment after cerebral ischemia/reperfusion (IR) injury in rats. (A) Western blot to detect the effect of PTP1B inhibitor (10 μM) on phospho-PERK, total-PERK, phospho-IRE1, total-IRE1, cleaved ATF6, and full length ATF6 protein expression in the rat ipsilateral cortex 24 h after IR injury (n = 5 per group). (B–D) Quantitative analysis of band density ratio of phosphor-PERK/total-PERK, phospho-IRE1/total-IRE1, and cleaved ATF6/full length ATF6. Results are presented as the mean ± SEM (n = 4 per group). (E) Double immunofluorescence to detect Bip expression in microglia (Iba-1) 24 h after IR injury. Scale bar = 50 μm. (F, G) Quantitative analysis of Bip+/Iba-1+ cell density and relative integrated optical density (IOD) of Bip in the ipsilateral cerebral cortex (presented as the mean ± SEM, n = 5 per group). (H–K) Double immunofluorescence to detect phospho-PERK, PERK, phospho-IRE1, and IRE1 expression in microglia (Iba-1) 24 h after IR injury. Scale bar = 50 μm. (L, M) Quantitative analysis of double-positive cell density ratio of p-PERK(+)Iba-1(+)/PERK(+)/Iba-1(+) and p-IRE1(+)Iba-1(+)/IRE1(+)Iba-1(+) in the ipsilateral cerebral cortex (presented as the mean ± SEM, n = 6 per group). *p < 0.05; **p < 0.01; ***p < 0.001 compared with vehicle group; p-PERK = phospho-PERK; t-PERK = total PERK; p-IRE1 = phospho-IRE1; t-IRE1 = total IRE1; sc = PTP1B inhibitor sc-222227; IOD = integrated optical density; IR = ischemia/reperfusion.