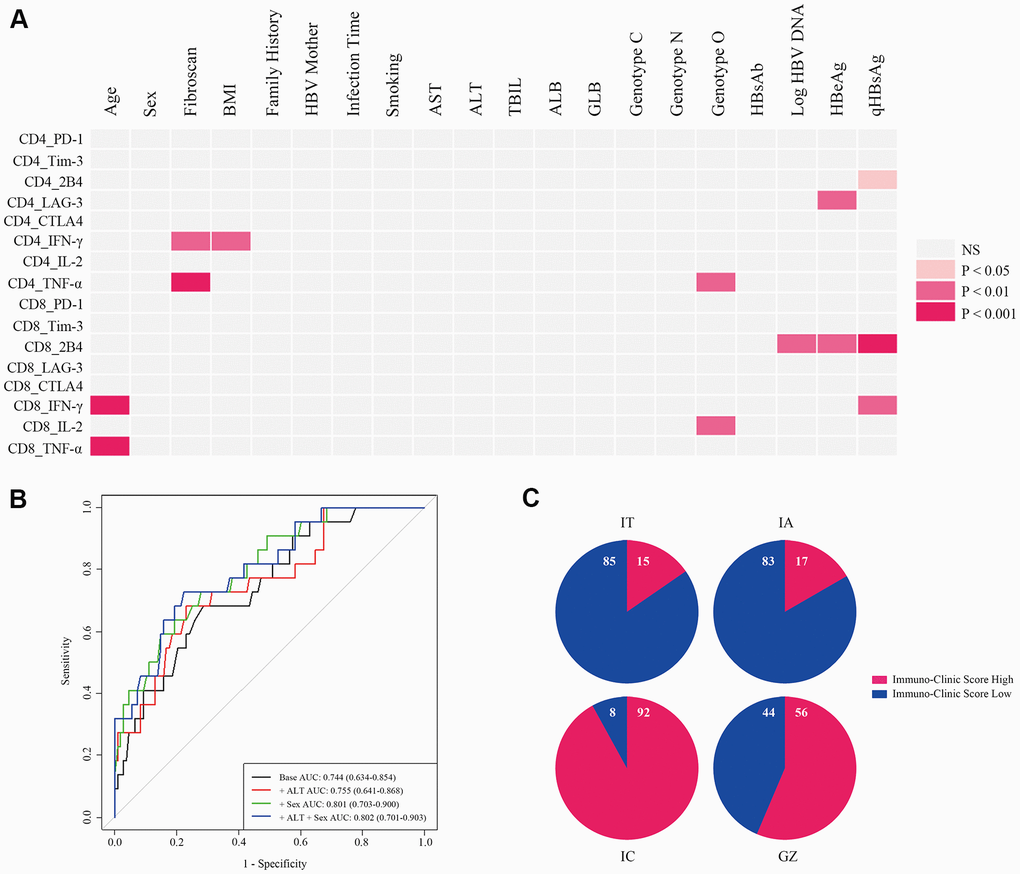
Figure 3.Development of an ICS model for the evaluation of comprehensive T cell immunity. (A) Correlations of antiviral cytokines (IFN-γ, TNF-α, and IL-2) and inhibitory molecules (PD-1, Tim-3, LAG-3, CTLA4, and 2B4) produced by CD4+ and CD8+ T cells with 18 clinical-virological characteristics were measured. Seven clinical-virological variables (Age, Fibroscan value, BMI, HBV genotype, Log HBV DNA, HBeAg, and qHBsAg) showed significant association with different immune variables. The Spearman correlation or Wilcoxon rank sum test was used to test the correlation. P < 0.05 is shown in color, and the red hue depth represents the degree of statistical difference. NS=not significant. (B) ROC curve analysis of different ICS models in all CHB patients. Four ROC curves are shown by different clinical-virological variables based on classifications from all CHB patients, and the ROC curve for the selected ICS model is displayed in green (+ Sex). AUC, sensitivity, and specificity of this ROC curve were 0.801 (95% CI 0.703-0.900), 0.727, and 0.722, respectively, and the cut-off value was 0.442. (C) Re-evaluation of T cell comprehensive immunity with the ICS model in patients at different CHB phases. Numbers in the blue and red proportion indicate the percentage of ICS-low and ICS-high patients, respectively.