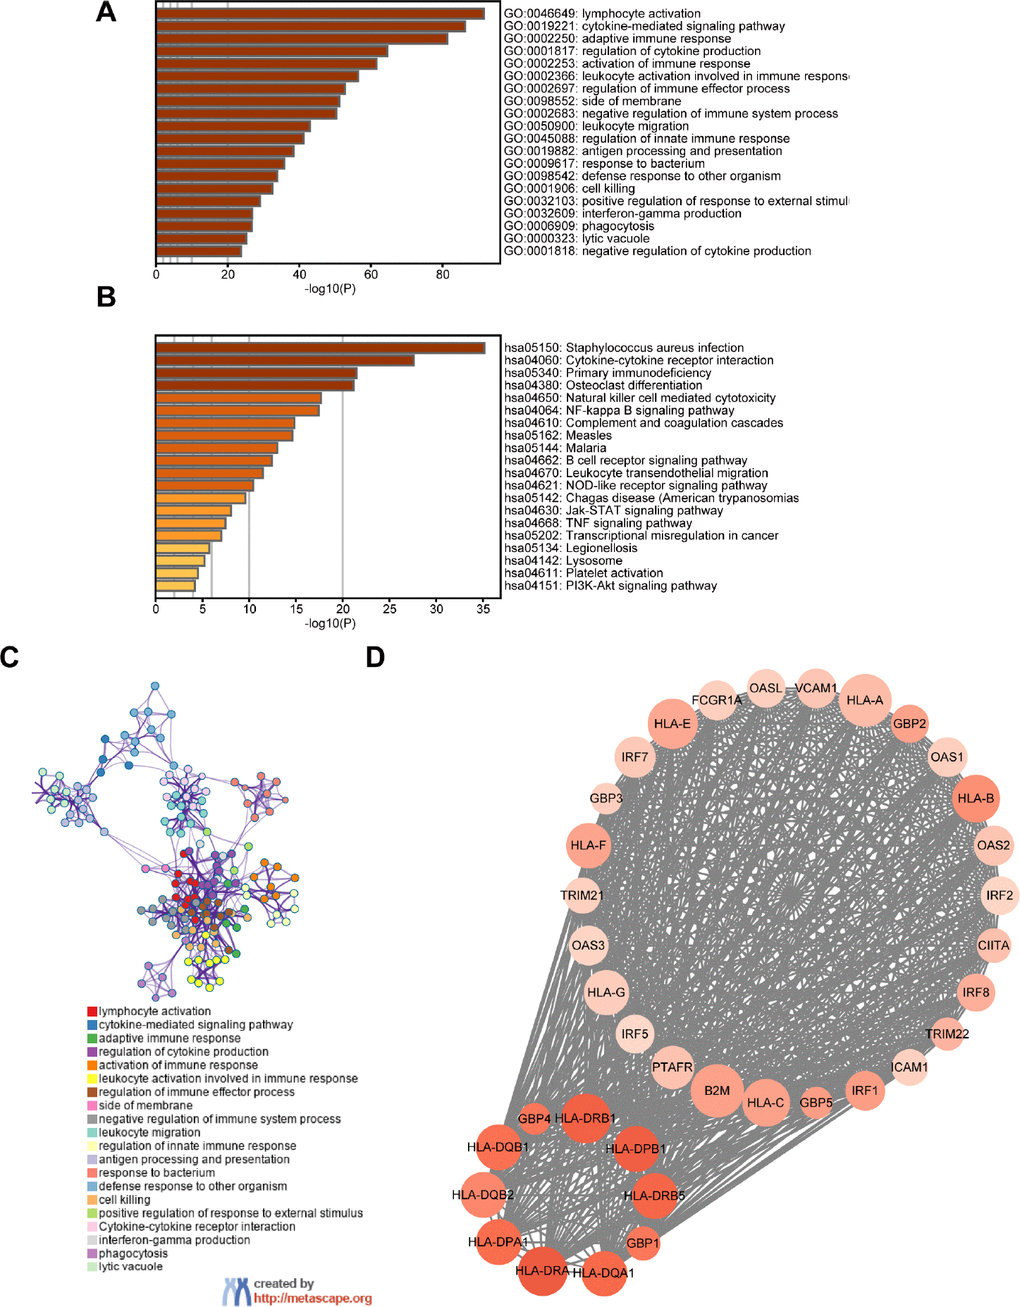
Figure 2.Screening of DEGs and functional analysis. (A) Heatmap of the GO enriched terms. (B) Heatmap of the KEGG enriched terms. (C) A network of GO and KEGG enriched terms. (D) The top one module. The color of nodes represents the log (FC) value and the size reflects the number of interacting proteins with the designated protein.