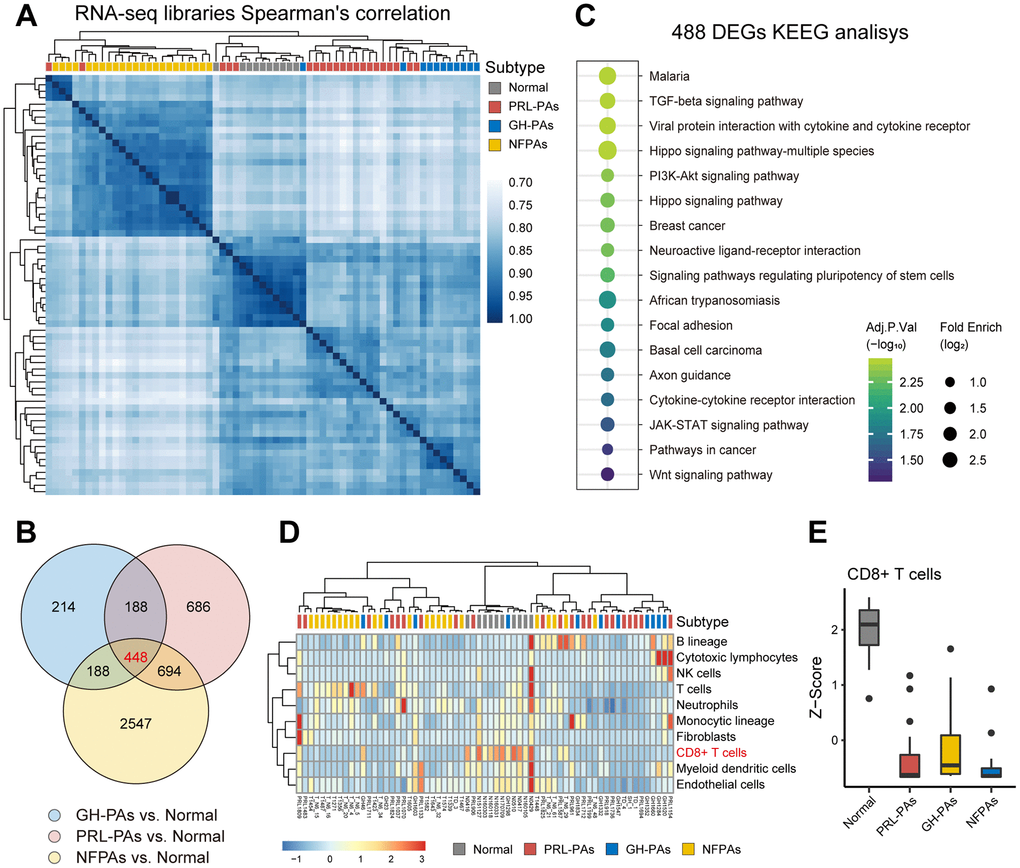
Figure 1.The transcriptional landscape of PAs. (A) Correlation heatmap of transcriptomic similarity among 21 PRL-PAs, 11 GH-PAs, 23 NFPAs and 9 normal pituitary tissues (Normal). Pituitary adenoma subtype is indicated by the color bar above the heatmap. (B) Venn diagram showing the intersection of DEGs among three subtypes of PAs vs. Normal. DEGs were identified by the R package DESeq2 under the cutoff of adjusted P value < 0.05. (C) KEGG pathway enrichment analysis of 448 overlapping DEGs, the dot plot shows pathways with an adjusted P value < 0.05. (D) The infiltration of eight subtypes of immune cell populations and two endothelial cell types in PA samples and normal pituitary tissues was evaluated using the expression levels of cell type specific markers using the MCP-counter [38]. The abundances of each cell types were normalized by z transformation across samples. (E) Boxplots of z score from Figure 1D showing the reduced infiltration of CD8+ T cells was reduced across PA subtypes compared to normal pituitary tissues.
Figure 1 — Genomic and transcriptomic analysis of pituitary adenomas reveals the impacts of copy number variations on gene expression and clinical prognosis among prolactin-secreting subtype | Aging